 |
| It remains to be determined whether the reflective bands associated with outer retinal tubulation can even be correlated with reflective bands arising from normal retina since the anatomy is so deranged. |
Soon the correlation to anatomical structures was narrowed down to the inner segment/outer segment (IS/OS) junction or ellipsoid zone (EZ). Throughout the literature, depending on research group, both terms were used and associated with band #2. Even within the same paper, band #2 was correlated to the EZ in one figure and named the IS/OS in another.3
Despite the confusion of what to call band #2 and the anatomical structure correlated with it, consensus at least exists on the appearance of this band: It reflects photoreceptor integrity and health, and its absence is a poor prognostic sign. Here, we explore the anatomy of the region and discuss two of the terms that have been used to describe it.
Anatomy of Band #2 Region
The inner segment of each photoreceptor is comprised of an IS myoid and an IS ellipsoid (ISel). The ISel is the distal-most portion of the IS and adjacent to the IS/OS junction. About 75 percent of the contentof the ISel is tightly packed with mitochondria. In a healthy retina, ISel mitochondria are long, thin and bundled parallel like uncooked spaghetti.4
The IS and OS is connected by a cilium, measuring approximately 0.25 μm by 1 μm, which is comprised of microtubules.4 A narrow gap (50-200 nm), can be seen on electron microscopic (EM) imaging and separates the IS from the OS.5 It’s not quite clear if this gap is real or an artifact. This passage, which includes the connecting cilium, is called the IS/OS junction.
Nomenclature: Pro-Ellipsoid Zone
The term “Ellipsoid Zone” arises from the reflectivity source of OCT band #2 correlating with the ISel. When authors compared OCT band #2 with histologic images, the apparent source of the signal appeared to correlate with the ISel, presumably arising from the ISel mitochondria.6,7 The ovoid mitochondria with multiple internal membranes (cristae) were thought to contribute to a high refractive index in this region and optically serve as microlenses.8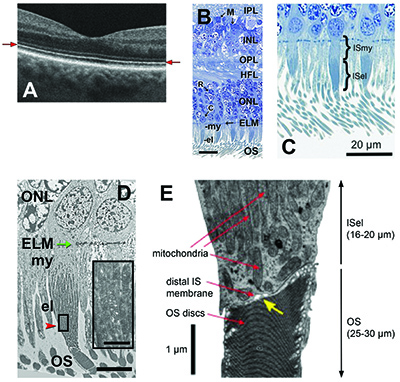 |
Genetic studies in which the age-related maculopathy susceptibility 2 (ARMS2) gene plays a role in age-related macular degeneration (AMD) have implied the importance of mitochondria and band #2, possibly through a mitochondria-related pathway. ARMS2 encodes for a mitochondrial protein found with ISel.10 A reported decreased intensity of the band #2 signal in AMD patients further supported this theory,11 but this may reflect a more general finding of photoreceptor dysfunction.
Moreover, electron micrographic images of photoreceptor degeneration, as in outer retinal tubulation (ORT), revealed morphologic changes in the ISel mitochondria. The mitochondria in these photoreceptors lost their well-structured arrangement and were randomly scattered, shortened and displaced toward the nucleus.12 In a 1:1 correlation between OCT and histology of a patient with ORT, a hyper-reflective band was seen on OCT and the reflectivity source was correlated with histology and EM images.
The images revealed short, randomly scattered mitochondria on both sides of the external limiting membrane and an absent OS. In this case, the hyper-reflective band on OCT could not represent the IS/OS junction, because OS were not present.13 However, it remains to be determined whether the reflective bands associated with ORT can even be correlated with reflective bands arising from normal retina since the anatomy is so deranged.
A 2011 paper correlated band #2 to the EZ based on distance measurements to adjacent hyper-reflective bands and thickness measurements of band #2 itself using Spectralis SD-OCT (Heidelberg Engineering).4 These authors correlated OCT findings to a photoreceptor model, which they created based on histologic measurements they obtained in a broad literature review. They found the thickness of band #2 to be similar to the anatomical measurements of the ISel portion.
In an attempt to reach a consensus on the terminology for retinal layers and the bands that appear on SD-OCT imaging, a panel of retinal specialists proposed a nomenclature for the posterior segment, choosing to call band #2 the EZ.14 However, controversy continues to surround band #2, with a recent publication using AO-OCT5 challenging the EZ-band #2 correlation point by point.
Nomenclature: Pro IS/OS Junction
This terminology revolves around the reflectivity source of OCT band #2 correlating with the IS/OS junction. Recent reports on AO-OCT imaging have focused on photoreceptor cellular details, and the light reflected within single cone photoreceptors was located at the IS/OS junction and correlated with band #2.15 Furthermore, thickness measurements of band #2 using AO-OCT imaging were found to be three to four times narrower than in the corresponding clinical OCT images and did not correspond to the thickness of the ISel (16-20 µm).5,16 |
| Dr. Rosenfeld is a professor at Bascom Palmer Eye Institute, University of Miami Miller School of Medicine. He has been the principal investigator and study chair for several clinical trials involving wet and dry AMD. Dr. Schaal is a retina researh fellow at Bascom Palmer. |
Another argument is that the ISel serves as a waveguide,2,6 and its contribution to the Stiles-Crawford effect is widely accepted.5 This is not surprising when having a closer look at the arrangement of the mitochondria in the ISel (long, thin and bundled), which resembles fiber optics and increasing in number with eccentricity.9 The OCT back-reflection from the IS/OS region seems to arise from the abrupt change in optical index of refraction at the IS/OS junction, and the ISel mitochondria (lipid rich) are thought to contribute to the high refractive index of the inner segment.17
Which Sides to Take?
So, which nomenclature is correct? Does band #2 correspond to the high reflectivity of the ISel mitochondria or is it the contribution to a refractive index change between IS and OS that’s responsible for generating band #2 at the level of the IS/OS junction? Both waveguiding and scattering contribute to this photoreceptor hyperreflective band.There’s no correct answer at this time and band #2 is referred to interchangeably as the IS/OS band or the EZ band. Regardless of your terminology, it’s important to acknowledge the research and theories from both sides and appreciate the significance of retinal anatomy and the OCT band toward understanding the principles of OCT imaging and outer photoreceptor pathology. RS
References
1. Drexler W, Morgner U, Ghanta RK, et al. Ultrahigh-resolution ophthalmic optical coherence tomography. Nat Med. 2001;7:502-7.2. Drexler W, Sattmann H, Hermann B, et al. Enhanced visualization of macular pathology with the use of ultrahigh-resolution optical coherence tomography. Arch Ophthalmol. 2003;121:695-706.
3. Drexler W. Cellular and functional optical coherence tomography of the human retina: the Cogan lecture. Invest Ophthalmol Vis Sci. 2007;48:5339-5351.
4. Spaide RF, Curcio CA. Anatomical correlates to the bands seen in the outer retina by optical coherence tomography: literature review and model. Retina. 2011;31:1609-19.
5. Jonnal RS, Kocaoglu OP, Zawadzki RJ, et al. The cellular origins of the outer retinal bands in optical coherence tomography images. Invest Ophthalmol Vis Sci. 2014;55:7904-7918.
6. Gloesmann M, Hermann B, Schubert C, et al. Histologic correlation of pig retina radial stratification with ultrahigh-resolution optical coherence tomography. Invest Ophthalmol Vis Sci. 2003;44:1696-1703.
7. Lu RW, Curcio CA, Zhang Y, et al. Investigation of the hyper-reflective inner/outer segment band in optical coherence tomography of living frog retina. J Biomed Opt. 2012;17:060504.
8. Fernandez EJ, Hermann B, Povazay B, et al. Ultrahigh resolution optical coherence tomography and pancorrection for cellular imaging of the living human retina. Opt Express. 2008;16:11083-11094.
9. Hoang QV, Linsenmeier RA, Chung CK, Curcio CA. Photoreceptor inner segments in monkey and human retina: mitochondrial density, optics, and regional variation. Vis Neurosci. 2002;19:395-407.
10. Fritsche LG, Loenhardt T, Janssen A, et al. Age-related macular degeneration is associated with an unstable ARMS2 (LOC387715) mRNA. Nat Genet. 2008;40:892-6.
11. Wu Z, Ayton LN, Guymer RH, Luu CD. Second reflective band intensity in age-related macular degeneration. Ophthalmology 2013;120:1307-1308 e1.
12. Schaal KB, Freund KB, Litts KM, et al. OUTER RETINAL TUBULATION IN ADVANCED AGE-RELATED MACULAR DEGENERATION: Optical coherence tomographic findings correspond to histology. Retina. 2015 Jan 29. [Epub ahead of print]
13. Litts KM, Messinger JD, Dellatorre K, et al. Clinicopathological correlation of outer retinal tubulation in age-related macular degeneration. JAMA Ophthalmol. 2015;133: 609-612
14. Staurenghi G, Sadda S, Chakravarthy U, Spaide RF; International Nomenclature for Optical Coherence Tomography (IN•OCT) Panel. Proposed lexicon for anatomic landmarks in normal posterior segment spectral-domain optical coherence tomography: The IN*OCT Consensus. Ophthalmology. 2014;121:1572-1578.
15. Zawadzki RJ, Cense B, Zhang Y, et al. Ultrahigh-resolution optical coherence tomography with monochromatic and chromatic aberration correction. Opt Express. 2008;16:8126-43.
16. Meadway A, Girkin CA, Zhang Y. A dual-modal retinal imaging system with adaptive optics. Opt Express. 2013;21:29792-29807.
17. Ko TH, Fujimoto JG, Duker JS, et al. Comparison of ultrahigh- and standard-resolution optical coherence tomography for imaging macular hole pathology and repair. Ophthalmology. 2004;111:2033-2043.