 |
 |
 |
The genetic component for progression of age-related macular degeneration to advanced disease, including geographic atrophy and neovascular disease, has been well documented.1-4 Early and intermediate disease stages, primarily characterized by the formation of drusen, precede each advanced subtype. To lower the rate of disease progression and preserve vision, we need to identify therapeutic targets for earlier, high-risk disease stages.
With advances in in vivo imaging, spectral-domain optical coherence tomography can noninvasively visualize and discriminate the retinal and choroidal layers. OCT can also directly visualize and measure retinal pigment epithelium irregularities, including area and volume where drusen develop.
Our studies and others’ have shown that OCT-derived drusen area and volume and retinal features, such as hyper-reflective foci and choroidal parameters, may aid in determining the likelihood of progression from early or intermediate to advanced AMD.5-10
Further characterization of drusen and retinal and choroidal morphology may help us identify biomarkers that may serve as early anatomic endpoints for clinical trials and facilitate the development of new AMD therapies. Our group studied whether higher drusen burden assessed by OCT in eyes with early and
intermediate-stage AMD is associated with genetic risk. Here, I describe that work.
A sparse knowledge base
What we know about the association between OCT-derived retina parameters and AMD-related genetic variants is sparse.11-12 We previously reported that genes in the complement pathway are associated with a higher risk of progression from small and intermediate to large drusen, and large drusen to GA and neovascularization.13
We also found a novel association between the ABCA1 gene in the high-density lipoprotein (HDL) pathway that reduced progression risk from normal to intermediate drusen and from intermediate to large drusen. The protective effects for transitions to advanced disease and larger drusen size have been found in other pathways. 14-15
We evaluated the association between genetic risk and OCT-derived drusen area and volume in a clinical cohort of patients with early and intermediate AMD. Understanding these relationships, along with other OCT parameters, may lead to the clinical use of these measurements to identify earlier high-risk phenotypes and better define progression risk.
Characterizing drusen on OCT may help us identify disease biomarkers. We evaluated associations between genes implicated in advanced AMD risk and drusen area and volume measurements based on OCT in eyes with clinically diagnosed early and intermediate AMD.16
 |
Study design and methods
• Population and classification of AMD phenotypes. All participants were previously enrolled in our ongoing genetic and epidemiologic studies of AMD beginning in 1985.17-20 They were derived from clinic populations and nationwide referrals and were followed prospectively. The study protocol includes an ocular examination, fundus photography and OCT imaging, as well as interviews and blood sampling. AMD phenotypes were based on ocular examination and ocular imaging. Eyes were classified using the Clinical Age-Related Maculopathy Staging (CARMS) system.21 Risk factors were determined using our standardized questionnaire that included age, gender, education, body mass index (BMI) and smoking.1
• Evaluation of drusen area and volume measurements. Beginning in 2007 our study protocols included OCT scans for the purpose of assessing parameters associated with various stages of AMD, progression and genetic factors. We conducted a retrospective review of Cirrus spectral-domain OCT 4000 and 5000 scans (Carl Zeiss Meditec) among individuals with one or both eyes with stage 2 or 3 disease. The OCT protocols included high-definition one-line and five-line scans, and macular cube (512 by 128:128 B-scans and 512 A-scans per B scan) over a 6-x-6-mm square, centered on the fovea.22-24 The OCT technician determined fovea position to match its known anatomic configuration.
Drusen area and volume measurements were determined by the Cirrus version 6.0 Advanced RPE Analysis algorithm, a fully automated algorithm based on a determination of the RPE floor and elevation measurements of RPE deformations. This yielded an automatic quantitative assessment of RPE deformations and calculated highly reproducible measurements of area and volume.23,24 The measurements provide an estimate of drusen burden for a 5-mm circle (perifoveal zone) centered at the fovea.
• Genotyping and genetic data. The study used array-based and gene-sequencing platforms as previously described to determine genotypes.17-20 We chose common variants in genes previously associated with drusen and AMD in the complement and HDL pathways and the gene locus on chromosome 10q26 given their consistent association with advanced disease or biologically plausible relationship to drusen formation.13,17-20,25,26
• Statistical methods. These analyses included 239 eyes of 179 patients. The study used two categorical comparisons in separate models for each outcome: eyes with some drusen but less than the median volume vs. no measurable drusen; and eyes with the median volume or more drusen vs. no measurable drusen. Eyes without advanced AMD at baseline were the reference adjusted for correlation between fellow eyes.27 All models were adjusted for age, sex, smoking, BMI and education.
The study assessed two distinct outcomes of interest: drusen area and drusen volume in the perifoveal zone. Genetic variables were defined as having zero, one or two risk or protective alleles. We combined the two CFH variants that convey different information about AMD risk into a risk score. Since we identified consistent significant associations in categorical analyses between drusen measurements and risk genotypes for CFH risk score and ARMS2, we looked in more detail at mean area and volume represented as continuous variables for these two genes and assessed the independent effects of each gene on drusen measurements.
Key findings
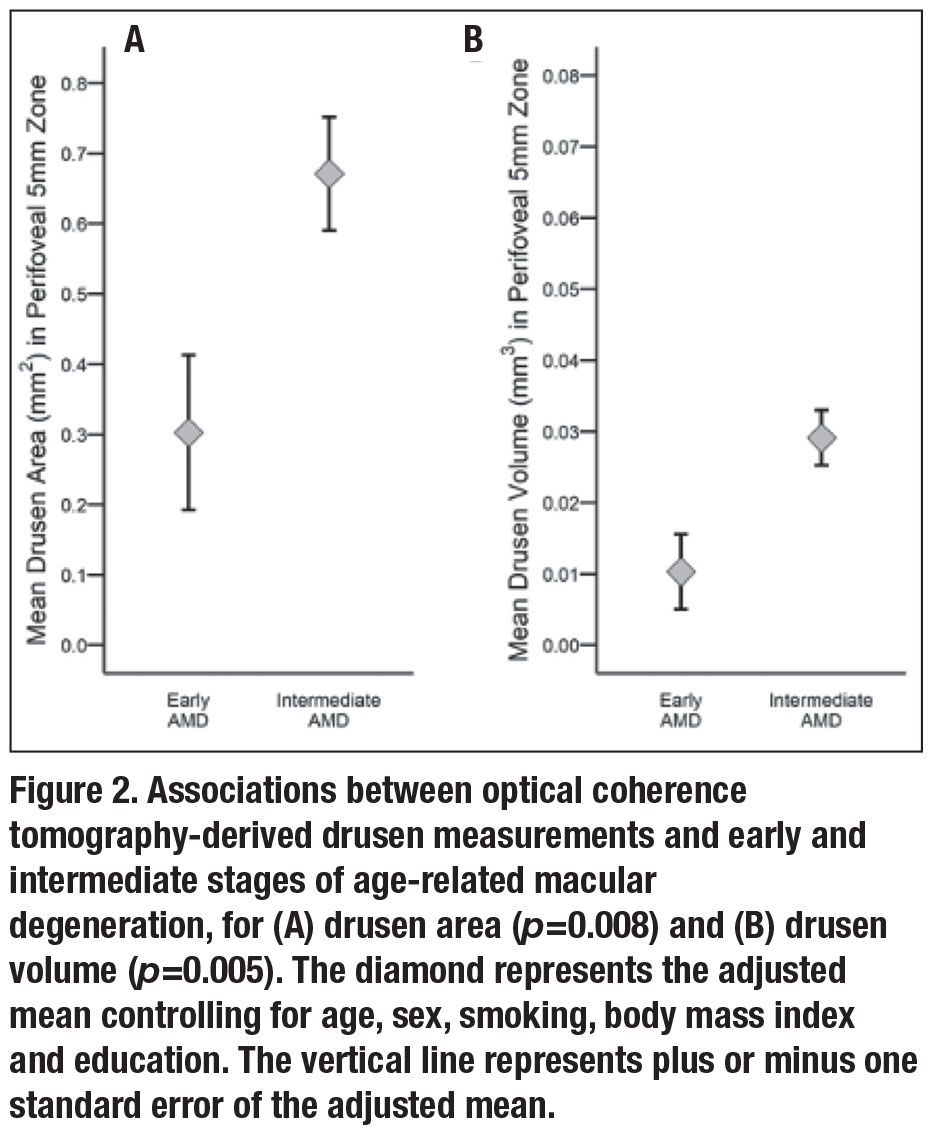 |
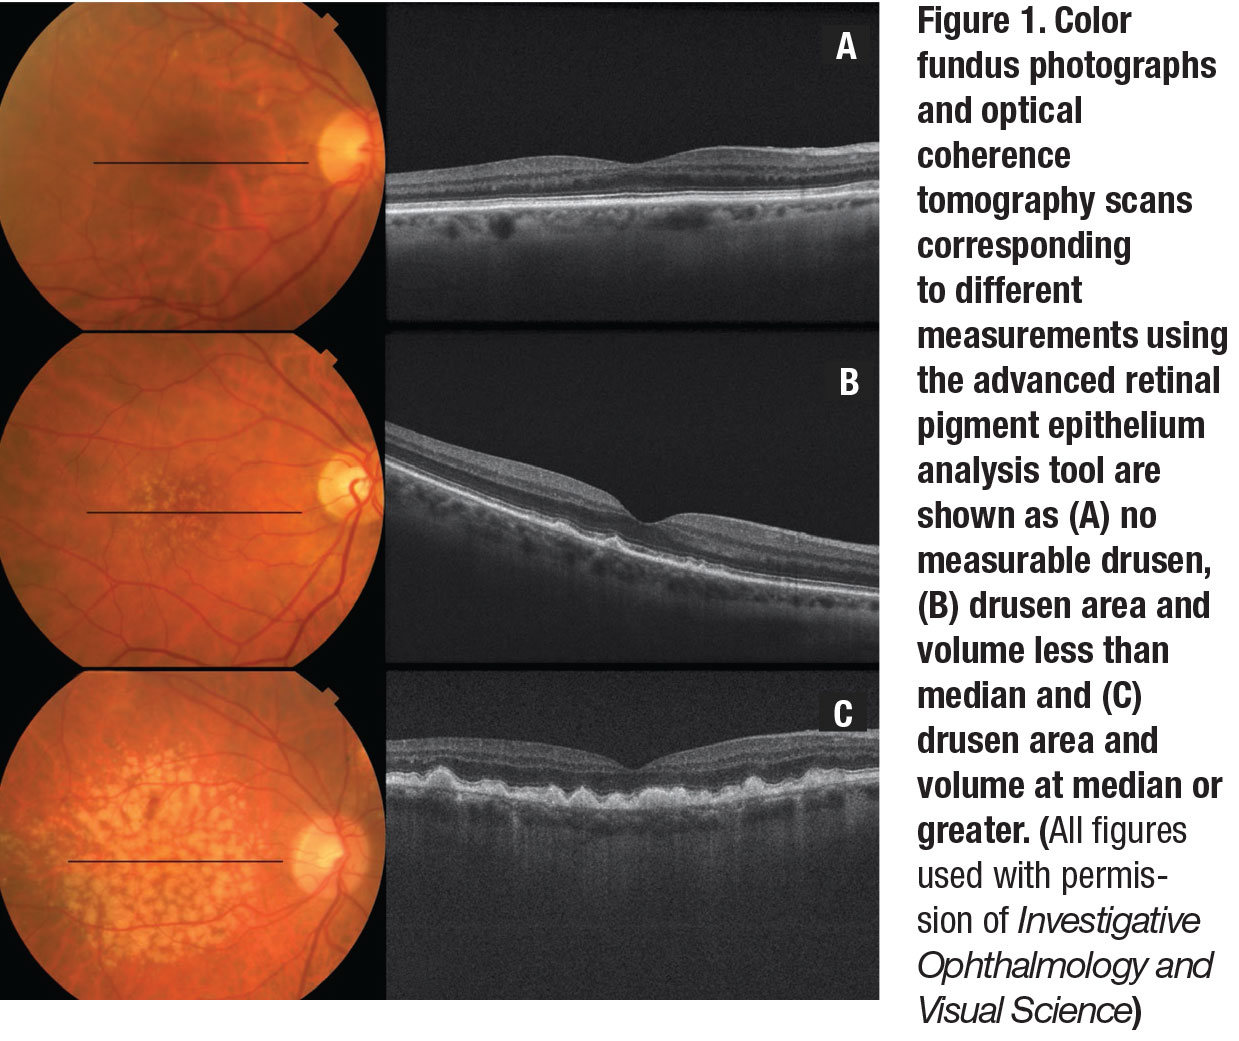
Figure 1 (page 35) displays representative color photographs and OCT scans corresponding to different measurements obtained using the Zeiss advanced RPE analysis tool.
• Association between OCT drusen measurements and AMD grade. Mean OCT-derived drusen area was significantly associated with AMD grade based on color photographs and was higher in intermediate vs. early AMD eyes after adjustments for age, sex, smoking, BMI and education (p=0.008) (Figure 2A). Similarly, mean drusen volume was greater in intermediate vs. early AMD (p=0.005) (Figure 2B).
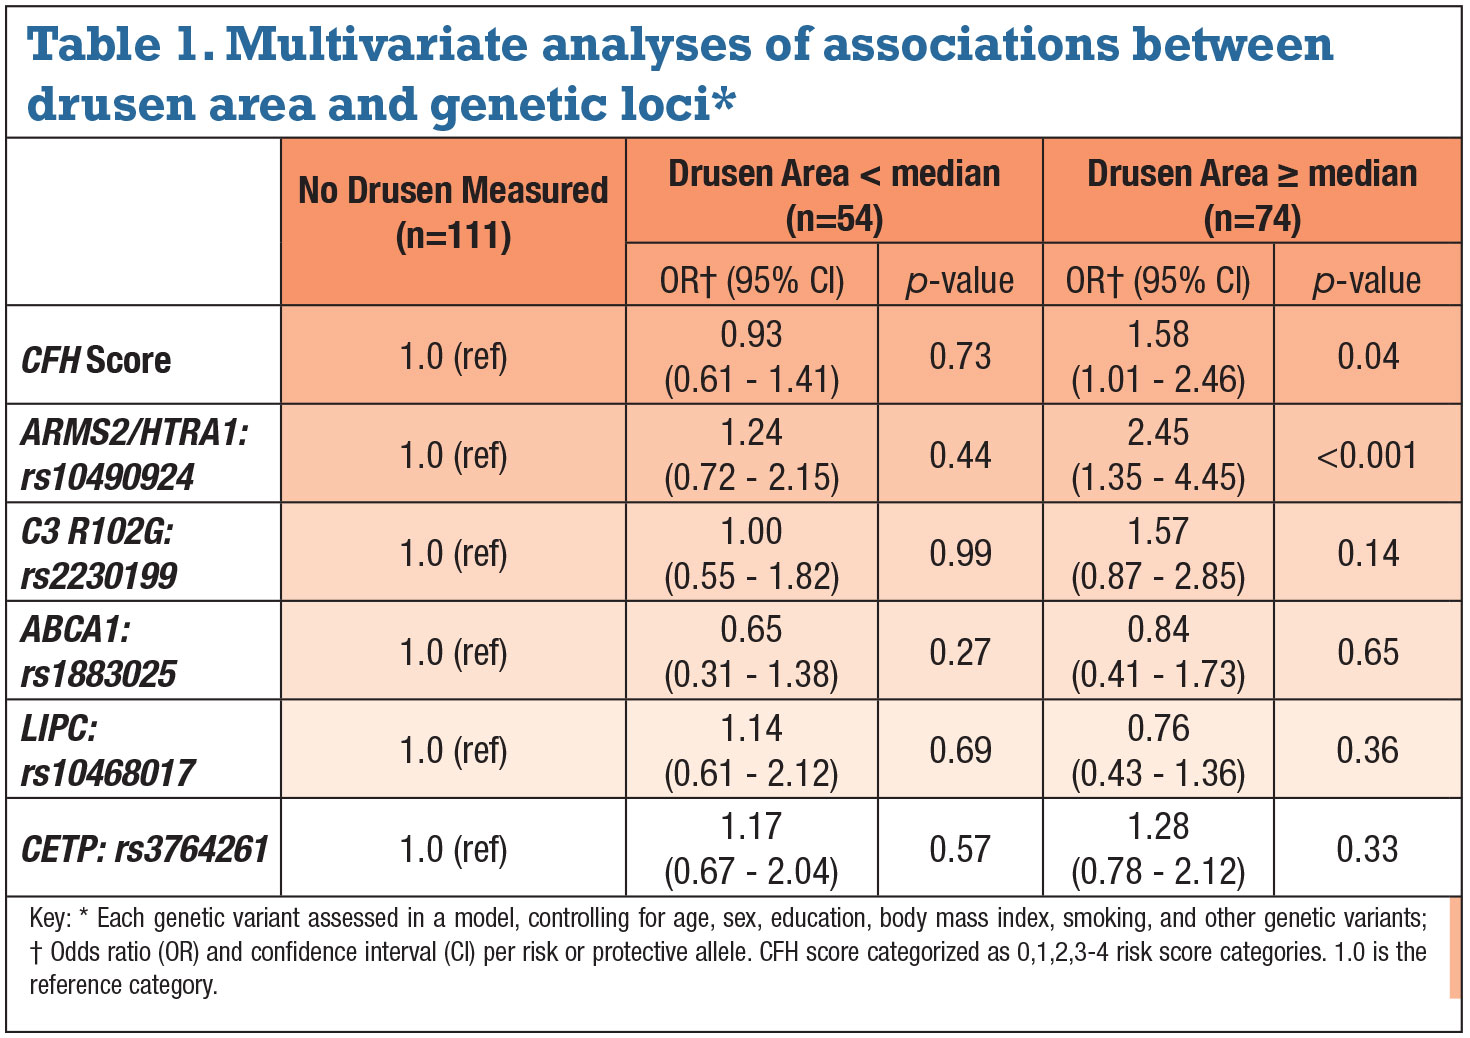
• Associations between drusen measurements and AMD genetic variants. A higher CFH score (combining two CFH variants) was associated with greater drusen area in the perifoveal 5-mm zone controlling for age, sex, smoking, BMI and education (Table 1). Drusen area greater than median vs. no measurable drusen increased per category of CFH score. Risk for greater drusen area increased 1.6 times for each genetic score category, and risk for greater drusen burden with three or more risk alleles in CFH score was fivefold higher. Drusen volume yielded similar results.
The variant in the complement pathway gene C3 R102G was significantly associated with greater drusen only in the univariate analysis.18 A greater number of risk alleles for the variant in ARMS2/HTRA1 was also associated with greater drusen area controlling for the previously noted variables. The variant at this locus carried a significant association with greater drusen area per each risk allele: a 2.45-fold increased risk (p<0.001). Similar results were seen for drusen volume.
• Multivariate analyses of associations between drusen burden and
genetic variants. When analyzing each genetic variable while controlling for all of the other variants, only two remained independently associated with a significantly greater drusen area: CFH risk score and the ARMS2/HTRA1 variant (Table 2, page 38). Similar results were seen for drusen volume. The HDL genes LIPC, ABCA1 and CETP were not significantly related when controlling for the other non-
genetic and genetic variants.
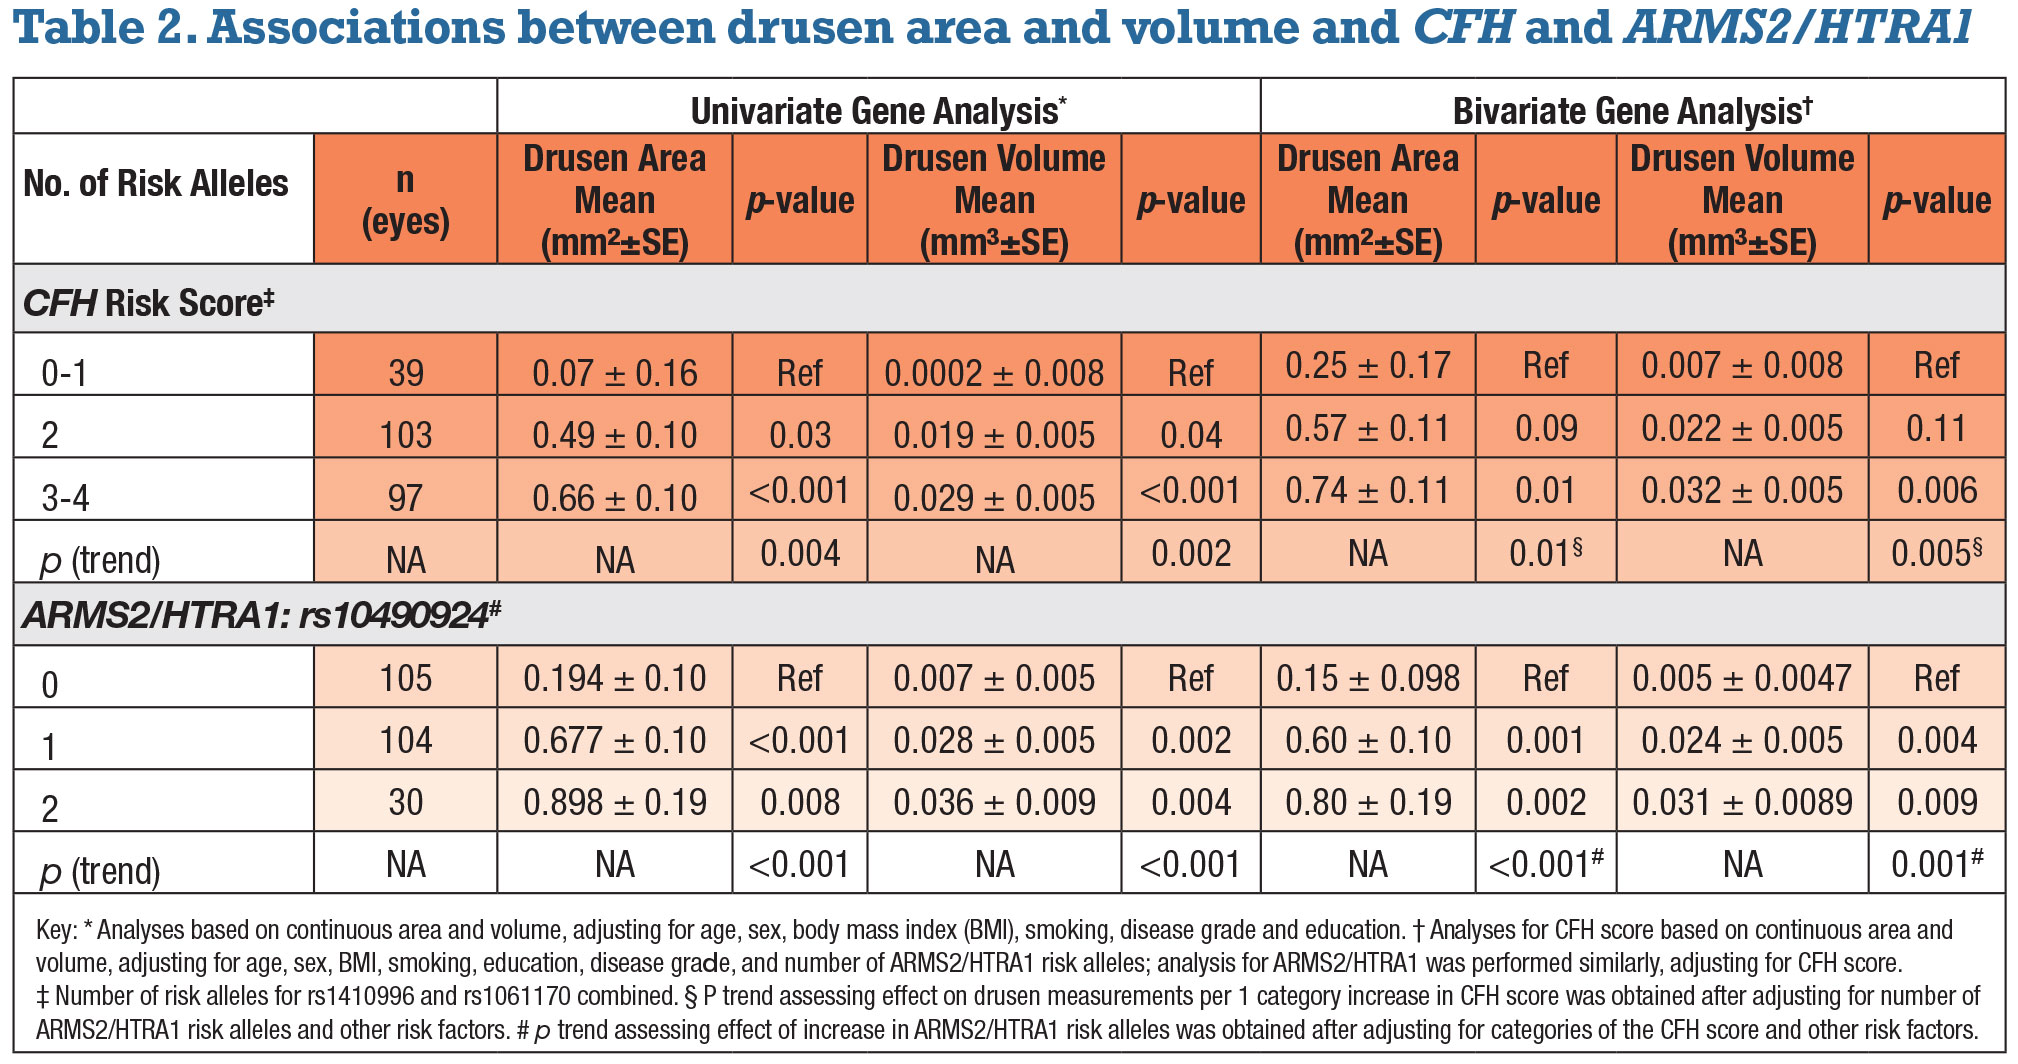
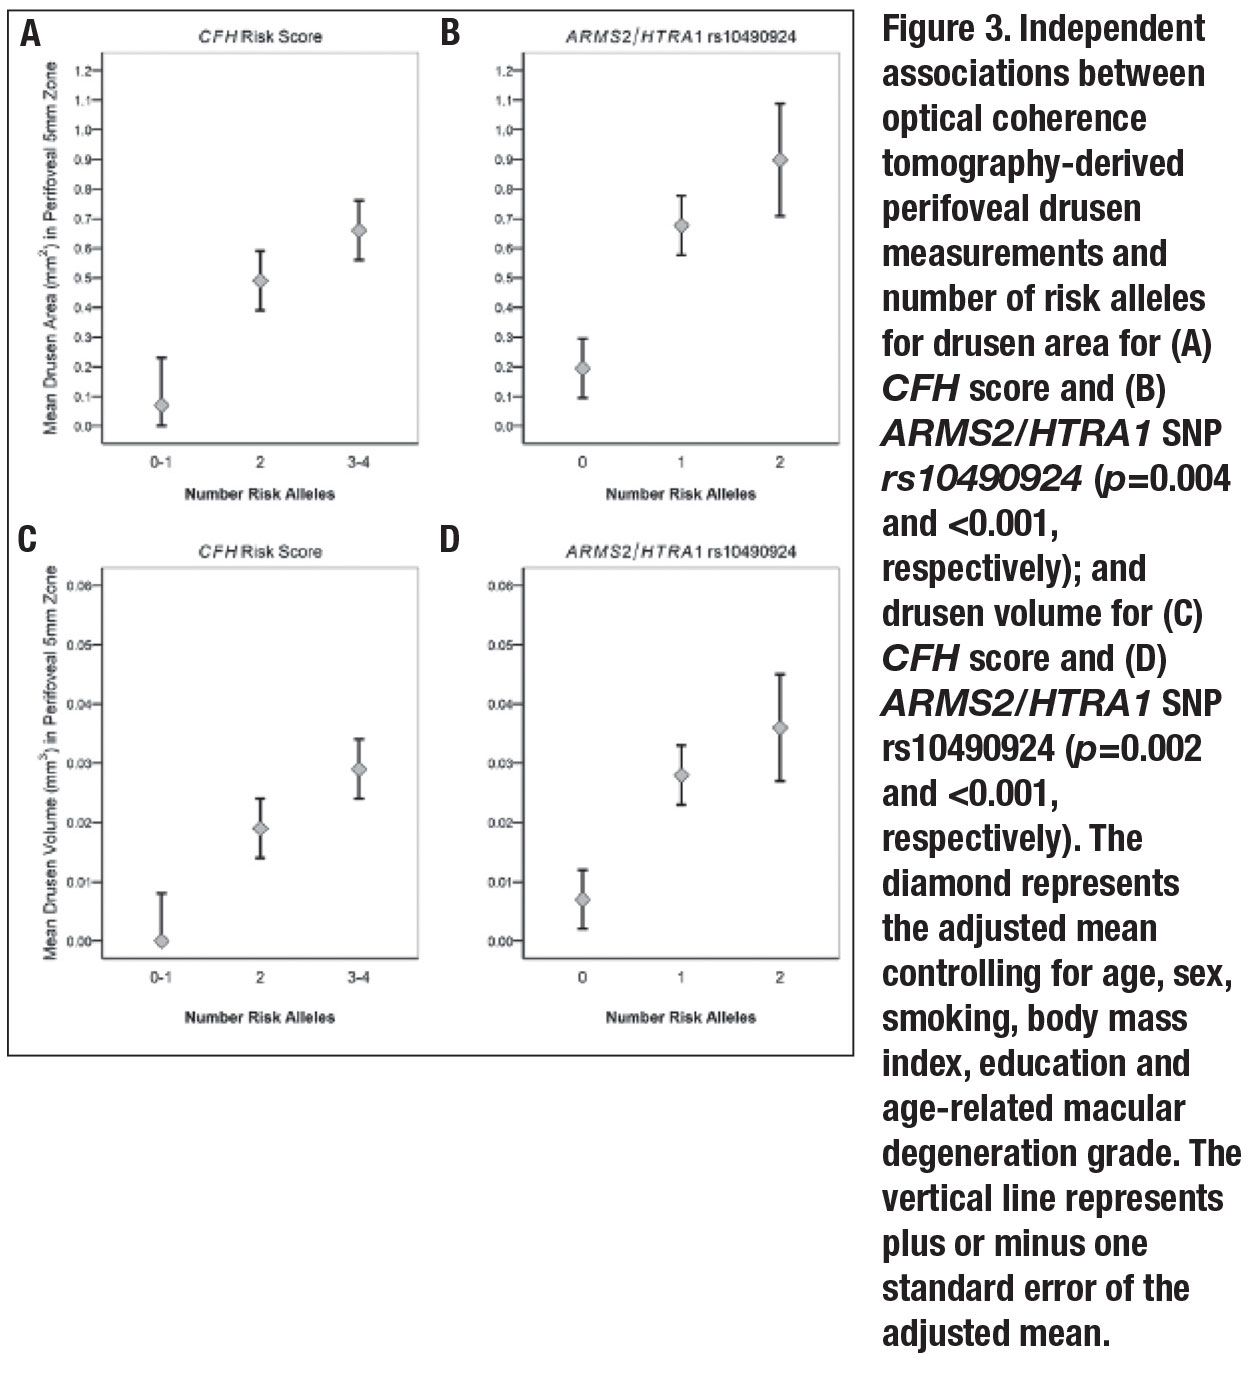
• Independent associations between drusen measurements, CFH score and ARMS2. Both mean perifoveal drusen area and volume increased with CFH score. The trends for increasing drusen burden as the CFH score increased were significant after adjusting for the previously noted variables along with AMD grades (p=0.004 for area, 0.002 for volume). Carriers of two risk alleles had greater drusen area and volume than patients with one or none (p=0.03 and 0.04, respectively); carriers of three or four risk alleles had significantly higher drusen area and volume than those with one or none (p<0.001 for both).
Similar comparisons were assessed for the ARMS2/HTRA1 variant. Mean drusen area and volume increased with the number of risk alleles after adjustment for other variables (p<0.001 for both drusen area and volume). Carrying two risk alleles vs. none was significantly related to greater drusen area and volume (p=0.008 and 0.004, respectively). Associations between OCT-derived perifoveal drusen measurements and genetic factors are depicted in Figure 3 (page 39).
When both genes were adjusted for each other (bivariate analyses), the associations between drusen measurements and CFH score were somewhat reduced. However, the trend for higher drusen area and volume with a higher score remained significant (p=0.01 and 0.005, respectively).
When the ARMS2/HTRA1 genetic variant was adjusted for CFH score, results were similar to the univariate analysis. Trends for drusen area and volume increasing with the number of ARMS2/HTRA1 risk alleles were significant (p<0.001and 0.001, respectively).
 |
What the findings mean
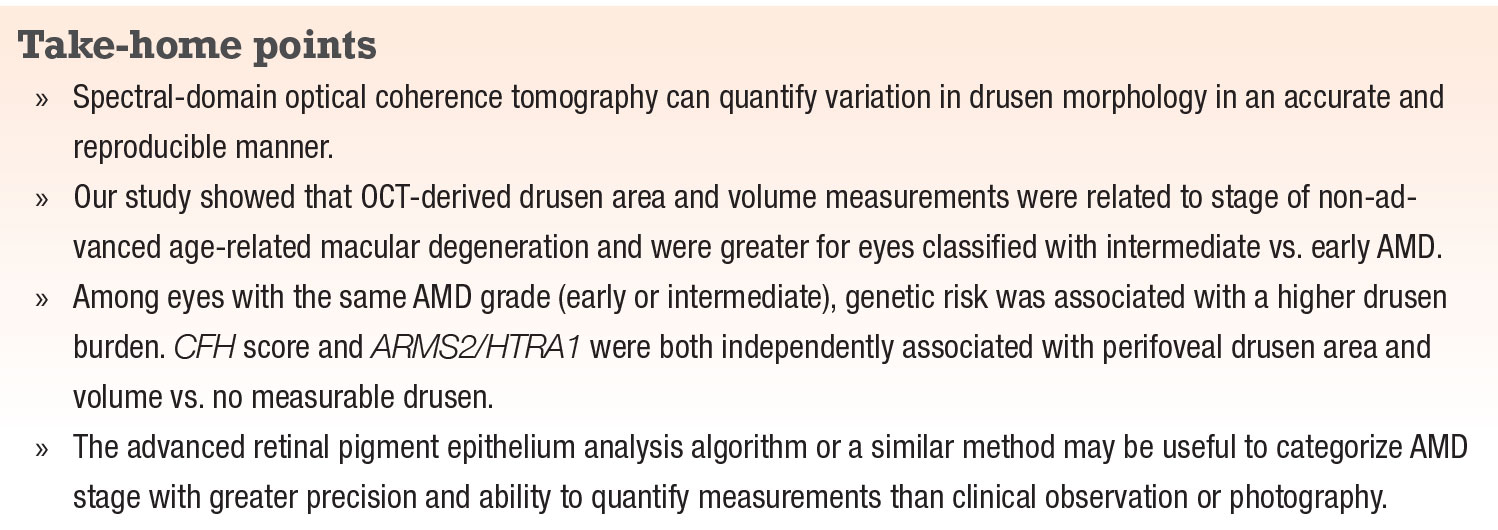
Drusen area and volume measurements were related to stage of non-advanced AMD and were greater for eyes classified with intermediate vs. early AMD. In addition, among eyes with the same AMD grade (early or intermediate), genetic risk was associated with a higher drusen burden. CFH score and ARMS2/HTRA1 were both independently associated with perifoveal drusen area and volume compared with no measurable drusen.
When comparing the adjusted means of the drusen area and volume for CFH score and ARMS2/HTRA1, we found significant trends for drusen measurements increasing with the number of risk alleles for each variant. The trends persisted when both genes were adjusted for each other as well as when the baseline AMD grade was included as a covariate in the analysis. So results show that these two different genetic variants contributed independently to drusen burden.
The associations between advanced AMD and the CFH Y402H variant as well as the intronic SNP in CFH rs1410996 have been well documented. The biologic mechanisms underlying their effect on drusen accumulation, however, have not been fully explored. Our previous analyses reported that rs1410996 had a stronger effect and Y402H a reduced effect when both were in the same model, suggesting that this intronic variant may be more strongly associated with AMD.3,4,17
CFH negatively regulates the alternate complement pathway and dampens the excessive C3 convertase activated by either immune complex deposition or from pathogens or damaged cell surfaces. CFH risk variants are functionally less efficient at dampening this response, leading to heightened complement activity, which can lead to AMD-related pathology. It should be noted that SNPs in the genes ARMS2 and HTRA1 at the chromosome 10q26 locus are in very high linkage disequilibrium and functional studies are needed to determine which gene products lead to AMD pathology.25
This advanced RPE analysis algorithm or a similar method may be useful to categorize AMD stage with greater precision and ability to quantify measurements than clinical observation or photography. Higher-resolution OCT may reduce variability in OCT grading and enhance the application of the RPE analysis algorithm. Future studies will provide more information about the impact of genetic variants on drusen morphology.
We did not find a significant association between OCT-derived drusen measurement and the HDL pathway genes (ABCA1, LIPC, and CETP), although effect estimates followed the trend seen in a previous prospective analysis.13,14,20,26 The CFH and ARMS2/HTRA1 genes were related to the transition from early to intermediate AMD based on color photographs,13,14 and were also associated with larger OCT-derived drusen measurements in this study.16
 |
 |
Bottom line
SD-OCT can quantify variation in drusen morphology in a way that is accurate and reproducible. Other AMD phenotypes detectable on OCT, including subfoveal fluid, retinal and choroidal thickness, retinal hyper-reflective foci and other drusen characteristics such as hyper-reflectivity and
homogeneity, present opportunities for exploration in the context of subtyping AMD and assessing risk of progression, as well as defining the associations with genetic variants. Further defining the relationship between disease severity, morphologic features, and genetic factors could enhance patient management and treatment as we move toward individualized precision medicine. RS
Contents of this paper were presented in part at the American Academy of Ophthalmology meeting, New Orleans, November 12, 2017, and Association for Research in Vision and Ophthalmology, Vancouver meeting, April 29, 2019.
REFERENCES
1. Seddon JM. Macular degeneration epidemiology: Nature-nurture, lifestyle factors, genetic risk, and gene-environment interactions: The Weisenfeld Award Lecture. Invest Ophthalmol Vis Sci. 2017;58:6513-6528.
2. Seddon JM, Francis PJ, George S, Schultz DW, Rosner B, Klein ML. Association of CFH Y402H and LOC387715 A69S with progression of age-related macular degeneration. JAMA. 2007;297:1793-1800.
3. Seddon JM, Reynolds R, Maller J, Fagerness JA, Daly MJ, Rosner B. Prediction model for prevalence and incidence of advanced age-related macular degeneration based on genetic, demographic, and environmental variables. Invest Ophthalmol Vis Sci. 2009;50:2044-2053.
4. Seddon JM, Rosner B. Validated prediction models for macular degeneration progression and predictors of visual acuity loss identify high-risk individuals. AOS Thesis. Am J Ophthalmol. 2019;198:223-261.
5. de Sisternes L, Simon N, Tibshirani R, Leng T, Rubin DL. Quantitative SD-OCT imaging biomarkers as indicators of age-related macular degeneration progression. Invest Ophthalmol Vis Sci. 2014;55:7093-7103.
6. Nathoo NA, Or C, Young M, et al. Optical coherence tomography-based measurement of drusen load predicts development of advanced age-related macular degeneration. Am J Ophthalmol. 2014;158:757-761.e1.
7. Abdelfattah NS, Zhang H, Boyer DS, et al. Drusen volume as a predictor of disease progression in patients with late age-related macular degeneration in the fellow eye. Invest Ophthalmol Vis Sci. 2016;57:1839-1846.
8. Folgar FA, Yuan EL, Sevilla MB, et al. Drusen volume and retinal pigment epithelium abnormal thinning volume predict 2-year progression of age-related macular degeneration. Ophthalmology. 2016;123:39-50.e1.
9. Ferrara D, Silver RE, Louzada RN, Novais EA, Collins GK, Seddon JM. Optical coherence tomography features preceding the onset of advanced age-related macular degeneration. Invest Ophthalmol Vis Sci. 2017;58:3519-3529.
10. Schmidt-Erfurth U, Waldstein SM, Klimscha S, et al. Prediction of individual disease conversion in early AMD using artificial intelligence. Invest Ophthalmol Vis Sci. 2018;59:3199-3208.
11. Chavali VRM, Diniz B, Huang J, Ying G-S, Sadda SR, Stambolian D. Association of OCT derived drusen measurements with AMD associated-genotypic SNPs in Amish population. J Clin Med. 2015;4:304-317.
12. Garcia Filho CA de A, Yehoshua Z, Gregori G, et al. Change in drusen volume as a novel clinical trial endpoint for the study of complement inhibition in age-related macular degeneration. Ophthalmic Surg Lasers Imaging Retina. 2014;45:18-31.
13. Yu Y, Reynolds R, Rosner B, Daly MJ, Seddon JM. Prospective assessment of genetic effects on progression to different stages of age-related macular degeneration using multistate Markov models. Invest Ophthalmol Vis Sci. 2012;53:1548-1556.
14. Yu Y, Reynolds R, Fagerness J, Rosner B, Daly MJ, Seddon JM. Association of variants in the LIPC and ABCA1 genes with intermediate and large drusen and advanced age-related macular degeneration. Invest Ophthalmol Vis Sci. 2011;52:4663-4670.
15. Yu Y, Wagner EK, Souied EH, et al. Protective coding variants in CFH and PELI3 and a variant near CTRB1 are associated with age-related macular degeneration. Hum Mol Genet. 2016;25:5276-5285.
16. Seddon JM, Dossett J, Widjajahakim R, Rosner B. Association between perifoveal drusen burden determined by OCT and genetic risk in early and intermediate age-related macular degeneration. Invest Ophthalmol Vis Sci. 2019;60:4469–4478.
17. Maller J, George S, Purcell S, et al. Common variation in three genes, including a noncoding variant in CFH, strongly influences risk of age-related macular degeneration. Nat Genet. 2006;38:1055-1059.
18. Maller JB, Fagerness JA, Reynolds RC, Neale BM, Daly MJ, Seddon JM. Variation in complement factor 3 is associated with risk of age-related macular degeneration. Nat Genet. 2007;39:1200-1201.
19. Seddon JM, Reynolds R, Rosner B. Peripheral retinal drusen and reticular pigment: Association with CFHY402H and CFHrs1410996 genotypes in family and twin studies. Invest Ophthalmol Vis Sci. 2009;50:586-591
20. Neale BM, Fagerness J, Reynolds R, et al. Genome-wide association study of advanced age-related macular degeneration identifies a role of the hepatic lipase gene (LIPC). Proc Natl Acad Sci USA. 2010;107:7395-7400.
21. Seddon JM, Sharma S, Adelman RA. Evaluation of the clinical age-related maculopathy staging system. Ophthalmology. 2006;113:260-266,
22. Gregori G, Wang F, Rosenfeld PJ, et al. Spectral domain optical coherence tomography imaging of drusen in nonexudative age-related macular degeneration. Ophthalmology. 2011;118:1373-1379.
23. Yehoshua Z, Rosenfeld PJ, Gregori G, et al. Progression of geographic atrophy in age-related macular degeneration imaged with spectral domain optical coherence tomography. Ophthalmology. 2011;118:679-686.
24. Gregori G, Yehoshua Z, Garcia Filho CA de A, et al. Change in drusen area over time compared using spectral-domain optical coherence tomography and color fundus imaging. Invest Ophthalmol Vis Sci. 2014;55:7662-7668.
25. Dewan A, Liu M, Hartman S, et al. HTRA1 promoter polymorphism in wet age-related macular degeneration. Science. 2006;314:989-992.
26. Chen W, Stambolian D, Edwards AO, et al. Genetic variants near TIMP3 and high-density lipoprotein-associated loci influence susceptibility to age-related macular degeneration. Proc Natl Acad Sci USA. 2010;107:7401-7406.
27. Glynn RJ, Rosner B. Regression methods when the eye is the unit of analysis. Ophthalmic Epidemiol. 2012;19:159-165.