Take-home Points
|
 |
|
Bios Dr. Orellana-Rios practices at Fundación Oftalmológica Los Andes in Santiago de Chile, Chile. Dr. Tong is a researcher at New York Eye and Ear Infirmary of Mount Sinai and Icahn School of Medicine at Mount Sinai in New York. Ms. Challa is a fourth-year medical student at the Ohio State University College of Medicine, Columbus. Dr. Smith is professor of ophthalmology and neuroscience at the Icahn School of Medicine at Mount Sinai and director of biomolecular retinal imaging at the New York Eye and Ear Infirmary of Mount Sinai. DISCLOSURES: Dr. Orellana-Rios was partially supported by the 2017 Fellowship Project Award granted by the GOAP from Bayer Healthcare. Dr. Smith is supported in part by National Institutes of Health/National Eye Institute Grant R01EY015520-10. The remaining authors report no relevant financial disclosures. |
Dry age-related macular degeneration, or non-neovascular AMD, has proven a far more difficult disease to manage than neovascular AMD. Whereas nAMD can be stabilized with anti-VEGF therapy, no approved treatment exists for the dry form of the disease.
The retinal pigment epithelium cell plays a central role in AMD since one of the earliest detectable disease markers is an abnormal pattern of in vivo autofluorescence,1 and fundus autofluorescence is a non-invasive imaging technology that allows us to assess the RPE monolayer. It’s based on the topographic mapping of the distribution of RPE fluorophores such as lipofuscin (L) granules, many of which also contain melanin or melanolipofuscin (ML).
Therefore, FAF can give us not only an anatomic interpretation of what is happening in the retina, but it can also provide functional information of the health status of the RPE. In this article, we explore the potential of FAF in managing non-nAMD.
New understanding of AF principles
Lipofuscin is the undegradable fraction of the byproducts on the visual cycle. It’s stored in the lysosomes inside the RPE cell, and it’s naturally autofluorescent at the clinical excitation wavelengths between 480 and 510 nm. So, the FAF method utilizes light emitted from L-fluorophores at emission spectra ranging from 500 to 800 nm.
However, major components of macular FAF, a superb indicator of RPE metabolism, are still uncertain, as the well-studied bisretinoid A2E was confirmed as minimally abundant in the macula compared to the periphery.2
Currently, the confocal scanning laser ophthalmoscope (cSLO) attains a higher- quality RPE image than the conventional fundus camera. The FAF is the highest at 10 degrees from fovea, but diminishes at the fovea because of obstruction from the macular pigment, although FAF is relatively homogeneous over the remainder of the posterior pole and retinal periphery. Hence, FAF follows the distribution of rods. The outer segments of these photoreceptors are the primary precursors of lipofuscin-derived RPE fluorophores.3
Some studies have evaluated ultra-widefield FAF imaging in patients with AMD, using a green excitatory beam of 532 nm and emission wavelengths between 540 and 800 nm. Interestingly, peripheral autofluorescence changes have been found more prevalent in eyes with AMD, supporting the idea that this disease is panretinal and not only in the macula.4
Subtypes of FAF imaging
Nevertheless, the most common subtypes of FAF utilized in a clinical setting include short-wavelength FAF (blue FAF), with an excitation laser at 488 nm, and near-infrared fundus autofluorescence (NIR-AF), which uses a 787-um excitation wavelength. Bluelight autofluorescence represents the more established method of FAF imaging and has been used in multiple classification schemes.
In contrast, the NIR-AF signal is considered to derive mostly from RPE melanin with smaller contributions from choroidal melanin when it’s oxidized. However, questions remain about whether multiple fluorophores localize to each RPE organelle and which organelle provides FAF signal in the NIR range.5
Total ultrastructural reconstruction of adult human perifoveal RPE indicates that there are more than 1,400 organelles significant to imaging.6 At least half are L or ML capable of generating FAF. Some of these organelles, specifically the melanosomes, preferentially localize to the apical processes of RPE cells. They not only shadow more posteriorly localized fluorophores, but they also may contribute their own FAF signal.7
A fascinating new finding from high-resolution microscopy is that ML dominates foveal RPE, and L dominates non-foveal RPE, thus relating regionally specific molecular heterogeneity to cones.5,8
Exposing an old foe: Reticular pseudodrusen
Reticular pseudodrusen (RPD), or subretinal drusenoid deposits (SDD), are lesions of AMD distinct from drusen, and, with choroidal insufficiency, make up the AMD phenotype of reticular macular disease (RMD).9 RPD confer a greater risk than drusen of progression to the advanced stages of AMD, especially geographic atrophy, now termed complete RPE and outer retinal atrophy (cRORA).10
RPD are extracellular subretinal drusenoid deposits seen on spectral-domain optical coherence tomography above the hyperreflective band corresponding to the RPE monolayer.11 They appear as associated hypoautofluorescent lesions on en face FAF along with hyporeflectant patterns on NIR imaging.
 |
|
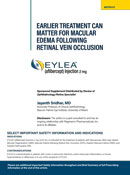
Figure 1. Bilateral near-infrared (NIR) and a spectral-domain optical coherence tomography scan of an 83-year-old man with age-related macular degeneration and unilateral left internal carotid artery occlusion shows in the right eye (A) a few bright reflections suggestive of retinal pigment epithelium loss. SD-OCT revealed confluent soft drusen with overlying RPE disruption and migration into the neural retina as hyperreflective foci (HRF). Subfoveal choroidal thickness was 189 µm. In the left eye (B) NIR shows a well-defined group of multiple homogeneous hyporeflectant lesions, typical of subretinal drusenoid deposits (SDD). The SD-OCT scan revealed multiple hyperreflective lesions between the RPE and ellipsoid zone, and a subfoveal choroidal thickness of 90 µm. Note that both features of reticular macular disease (RMD)—SDD and choroidal thinning—are present only in the left eye, where the ophthalmic artery perfusion of the choroid is compromised due to internal carotid occlusion. This is suggestive of choroidal hypoperfusion as a mechanism for the presence of RMD in AMD. An illustrative example (C) of migrating RPE (orange) using the hyperspectral AF technique. In figure A they appear on SD-OCT as HRF, which are strong predictors of future macular atrophy. |
Owing to the poor visibility of RPD on clinical examination and on color fundus photography, the original Age-Related Eye Disease Study (AREDS) reports didn’t describe the specific lesion called RPD. The advent of more recent imaging methods—namely FAF, NIR and OCT—makes it more likely to determine the presence of RPD with greater accuracy.
A recent study examined RPD in FAF images of 5,021 eyes of a subset of 2,516 AREDS2 participants.12 It reported RPD in 24 percent of eyes and bilateral lesions in 62 percent of participants with RPD. Prevalence of RPD varied with baseline AREDS AMD severity level: from 6 percent in early AMD to 36 percent in GA.
After accounting for AMD level and fellow-eye status, participants had a twofold risk of progression to late AMD in eyes with RPD and a 2.5-fold risk of macular atrophy.
In eyes with very early AMD, AREDS also found that the presence of RPD raised the risk of late AMD almost tenfold, highlighting the role of RPD as an independent risk factor. This also affirmed the more recent reclassification of RPD as intermediate AMD, along with large soft drusen, as much more advanced AMD requiring early diagnosis. However, their detection in a clinical setting can remain a challenge.
Potential role of AI
 |
Artificial intelligence may aid physicians on this task. Researchers applied deep learning (DL) to the automated detection of RPD from color fundus photographs, on which they’re not consistently discernible by human graders, by training the DL from corresponding FAF images, on which graders can consistently identify RPD.13
This DL model, called label transfer, was applied to the AREDS2 dataset, studying FAF imaging and color photos on 4,724 eyes conducted at 66 selected clinic sites from a large population of more than 2,000 individuals with AMD. The positions of the RPD on the FAF images were transferred as labels to the color fundus images, and the DL was trained to identify the labeled lesions on color photos only.
By testing the DL on a different set of unlabeled photos, these researchers showed that it identified RPD presence on the corresponding FAF images with an accuracy equal or superior to that of a human grader. This model may even augment the detection of this high-risk AMD phenotype and could be applied to screening where only color photos are available.
Possible CVD-RPD connection
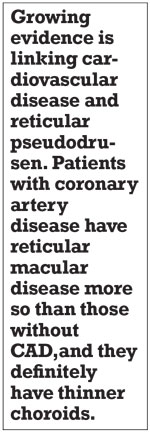
Additionally, growing evidence is linking cardiovascular disease (CVD) and RPD. Patients with coronary artery disease (CAD) have reticular macular disease more often than those who don’t,14 and definitely have thinner choroids.15 RPD are associated with decreased longevity,16 with CVD long suspected as the culprit. This theory of CVD causality received recent striking support from a histopathology of 1,777 study eyes.17
The authors classified donor eyes with both the four- and nine-step Minnesota Grading System and the AREDS AMD classification system for eye-bank eyes. They detected RPD in 13 percent of examined eyes. RPD, alone among the AMD lesions, were highly associated with cardiovascular death.
 |
Other studies found that age-related maculopathy susceptibility (ARMS2) risk was highly associated with RPD,12 whereas complement factor H risk was not.18 There is also an association of ARMS2 with elevated C-reactive protein. That may be relevant in this context because C-reactive protein is associated with CAD (Figure 1, Page 19).
Next-gen AF assessment in AMD
 |
FAF imaging may serve as a quantifiable endpoint in clinical trials related to non-nAMD. Most of the current classifications are based on qualitative description or patterns of FAF in AMD. Nevertheless, the strong AF signal has high potential for noninvasive, spatially and molecularly precise early detection, longitudinal follow-up and in vivo target discovery, as in the following methods:
• Quantitative fundus autofluorescence. qAF is a novel, innovative imaging modality to measure in vivo the L-related FAF from the RPE. This method, introduced in 2011, is performed by calibrating the FAF image to an internal reference of known fluorescence efficiency within a cSLO OCT, making it possible to reproducibly quantify and compare FAF intensity between patients and across time. It provides the spatial distribution of the fluorescence intensities, which can then be captured by a pattern or geometric region-of-interest on the macula.
As FAF has been established as a qualitative tool to visualize L components in vivo, qAF has demonstrated quantitatively a decline in fluorescence intensity with decreasing RPE health and increasing severity of non-nAMD. This suggests that loss, not increase, of L-fluorophores signifies AMD progression.19
• Fluorescence lifetime imaging ophthalmoscopy. FLIO is an emerging imaging modality for in vivo measurement of lifetimes of endogenous retinal fluorophores. The fluorescence lifetime is the average amount of time a fluorophore remains in the excited state following excitation. The FLIO device is also based on an OCT system. Autofluorescence lifetimes are excited at 473 nm and recorded in two spectral wavelengths channels. Typically, mean autofluorescence lifetimes in a 30-degree retinal field are investigated. For example, in non-nAMD, ring patterns of prolonged FLIO lifetimes 1.5 to 3 mm from the fovea can be appreciated. 20
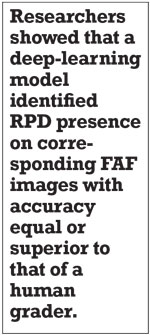
• Hyperspectral autofluorescence. Drusen are focal and recognizable clinically using color fundus photography and advanced OCT. Sub-RPE deposits contain basal linear (BLinD) and basal laminar deposits (BLamD). Very thick BLamD may be visible on OCT. BLinD is the precursor of soft drusen and isn’t visible on OCT, hence the detection of BLinD would provide a way to diagnose AMD at the earliest stage (Figure 2, page 21).
Hyperspectral imaging combines conventional imaging and spectroscopy to obtain spectral and spatial information from specimens. This technology was recently applied in our studies to extract the spectra of the AF emissions of drusen and RPE after excitation by appropriate wavelengths—for example, 480 nm that’s used in standard AF imaging—and thus identify these components in donor retina tissues.
 |
|
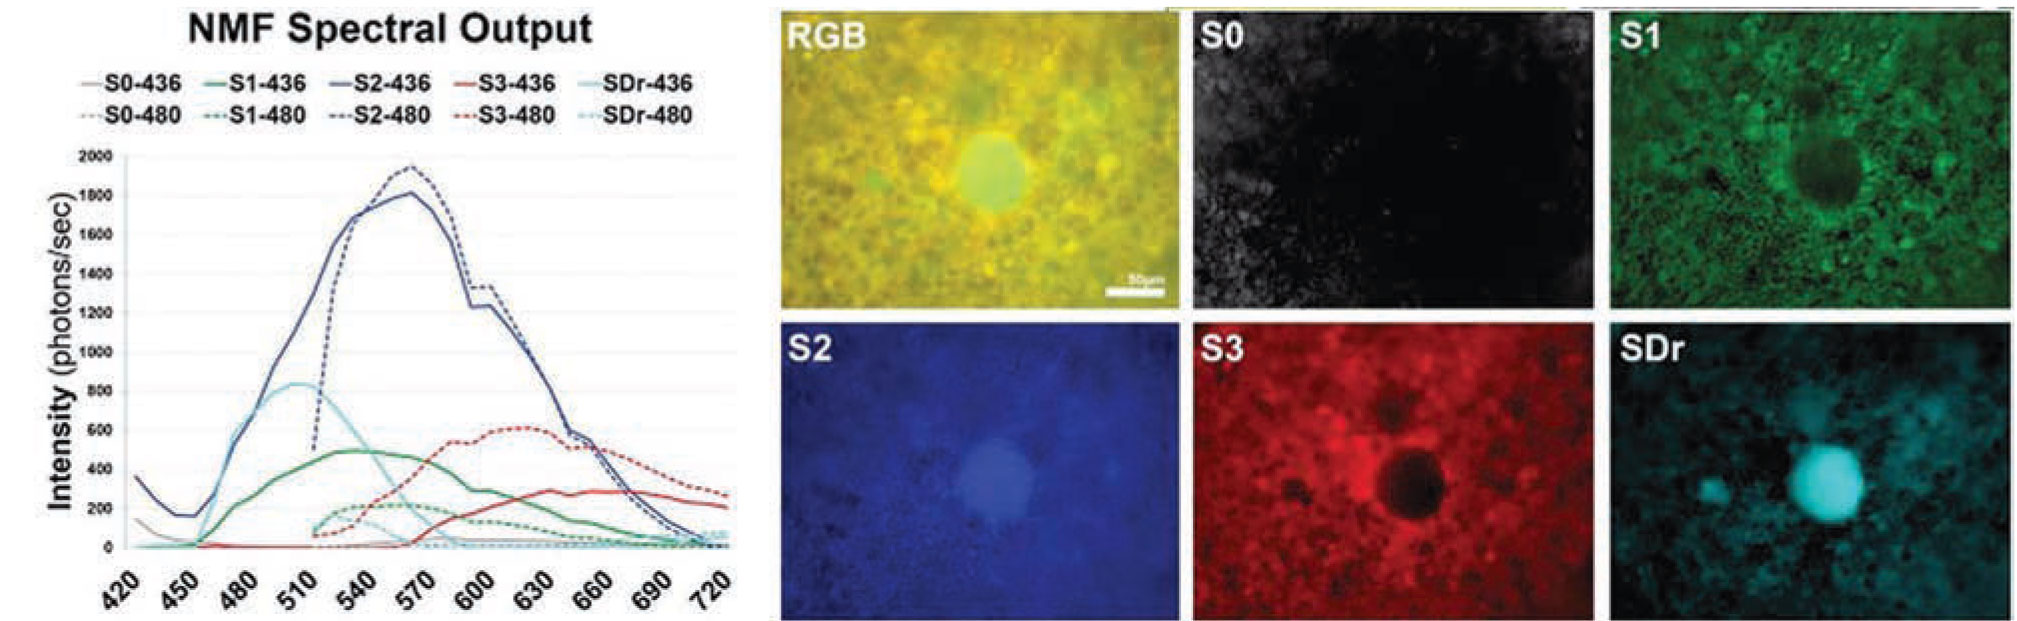
Figure 3. Recovered spectra (left) and tissue localizations (right) of the main fluorophores found in a flat-mounted retinal pigment epithelium/Bruch's membrane. The spectra from drusen and sub-RPE deposits in an age-related macular degeneration tissue at lambdaex 436 nm and lambdaex 480 nm are the two azure curves (SDr), and their corresponding tissue sources labeled SDr (note central druse). The peak of spectra from drusen is at 510 nm at lambdaex 436 nm excitation. This spectrum is sensitive and specific for drusen and sub-RPE deposits, and provides an excellent way to understand AMD biogenesis. The other three spectra (green, blue and red curves) come from the RPE lipofuscin (S1, S2) and melanolipofuscin (S3) organelles. S0 is from the Bruch's membrane. Scale bar: 50 µm. |
The hyperspectral images were acquired at each emission wavelength between 420 and 720 nm with a hyperspectral camera at two excitation wavelengths (lambdaex 436 nm and lambdaex 480 nm). We analyzed the hyperspectral images to recover the strongest emission spectra and map their corresponding tissue localizations by using a non-negative tensor factorization (Figure 3).
We also studied the drusen spectral signature at lambdaex 450 nm excitation and demonstrated that it also has a peak at 510 nm and a similar shape to that at lambdaex 436 nm.21
This demonstrates the feasibility of a clinical hyperspectral AF camera with a safe 450 nm excitation. It could detect the spectra of drusen and sub-RPE deposits, diagnose AMD at an early stage in vivo, and facilitate the development and monitoring of new therapies based on specific molecular defects.
Bottom line
Fundus autofluorescence is a valuable tool for imaging eyes with dry AMD and allows for identification of patients with not only a high risk of progression to late AMD, such as eyes with RPD, but also major morbidity and mortality due to cardiovascular diseases. Newer methods of FAF may serve as a quantifiable endpoint in ongoing clinical trials related to non-neovascular AMD. These advances may extend profound health and social benefits to our aging population. RS
REFERENCES
1. Schmitz-Valckenberg S, Holz FG, Bird AC, Spaide RF. Fundus autofluorescence imaging: Review and perspectives. Retina. 2008;28:385-409.
2. Ablonczy Z, Higbee D, Anderson DM, et al. Lack of correlation between the spatial distribution of A2E and lipofuscin fluorescence in the human retinal pigment epithelium. Invest Ophthalmol Vis Sci. 2013;54:5535-5542.
3. Ach T, Huisingh C, McGwin G Jr, et al. Quantitative autofluorescence and cell density maps of the human retinal pigment epithelium. Invest Ophthalmol Vis Sci. 2014;55:4832-4841.
4. Küçükiba K, Erol N, Bilgin M. Evaluation of peripheral retinal changes on ultra-widefield fundus autofluorescence images of patients with age-related macular degeneration. Turk J Ophthalmol. 2020;50:6-14.
5. Bermond K, Wobbe C, Tarau IS, et al. Autofluorescent granules of the human retinal pigment epithelium: phenotypes, intracellular distribution, and age-related topography. Invest Ophthalmol Vis Sci. 2020;61:35.
6. Pollreisz A, Messinger JD, Sloan KR, et al. Visualizing melanosomes, lipofuscin, and melanolipofuscin in human retinal pigment epithelium using serial block face scanning electron microscopy. Exp Eye Res. 2018;166:131-139.
7. Guan Z, Li Y, Jiao S, et al. A2E distribution in rpe granules in human eyes. Molecules. 2020;25:1413.
8. Anderson DMG, Messinger JD, Patterson NH, et al. Lipid landscape of the human retina and supporting tissues revealed by high-resolution imaging mass spectrometry. J Am Soc Mass Spectrom. 2020;31:2426-2436.
9. Smith RT, Sohrab MA, Busuioc M, Barile G. Reticular macular disease. Am J Ophthalmol. 2009;148:733-743.e2.
10. Sadda SR, Guymer R, Holz FG, et al. Consensus definition for atrophy associated with age-related macular degeneration on OCT: Classification of Atrophy Report 3. Ophthalmology. 2018;125:537-548.
11. Zweifel SA, Spaide RF, Curcio CA, Malek G, Imamura Y. Reticular pseudodrusen are subretinal drusenoid deposits. Ophthalmology. 2010;117:303-312.e1.
12. Domalpally A, Agrón E, Pak JW, et al. Prevalence, risk, and genetic association of reticular pseudodrusen in age-related macular degeneration: Age-Related Eye Disease Study 2 Report 21. Ophthalmology. 2019;126:1659-1666.
13. Keenan TDL, Chen Q, Peng Y, et al. Deep learning automated detection of reticular pseudodrusen from fundus autofluorescence images or color fundus photographs in AREDS2. Ophthalmology. 2020;127:1674-1687.
14. Cymerman RM, Skolnick AH, Cole WJ, Nabati C, Curcio CA, Smith RT. Coronary artery disease and reticular macular disease, a subphenotype of early age-related macular degeneration. Curr Eye Res. 2016;41:1482-1488.
15. Ahmad M, Kaszubski PA, Cobbs L, Reynolds H, Smith RT. Choroidal thickness in patients with coronary artery disease. PLoS One. 2017;12:e0175691.
16. Klein R, Meuer SM, Knudtson MD, Iyengar SK, Klein BE. The epidemiology of retinal reticular drusen. Am J Ophthalmol. 2008;145:317-326.
17. Mano F, Sprehe N, Olsen TW. Association of drusen phenotype in age-related macular degeneration from human eye-bank eyes to disease stage and cause of death. Ophthalmol Retina. 2020;S2468-6530(20)30462-0.
18. Smith RT, Merriam JE, Sohrab MA, Pumariega NM, Barile G, Blonska AM, et al. Complement factor H 402H variant and reticular macular disease. Arch Ophthalmol. 2011;129:1061-1066.
19. Orellana-Rios J, Yokoyama S, Agee JM, et al. Quantitative fundus autofluorescence in non-neovascular age-related macular degeneration. Ophthalm Surg Lasers Imaging Retina. 2018;49:S34-S42.
20. Sauer L, Vitale AS, Modersitzki NK, Bernstein PS. Fluorescence lifetime imaging ophthalmoscopy: autofluorescence imaging and beyond. Eye (Lond). 2021;35:93-109.
21. Tong Y, Ach T, Curcio CA, Smith RT. Hyperspectral autofluorescence characterization of drusen and sub-RPE deposits in age-related macular degeneration. Ann Eye Sci. 2021;6:4.