 |
|
Bios
Dr. Pandit is a first-year vitreoretinal fellow at Wills Eye Hospital, Philadelphia. Dr. Hsu is with Mid Atlantic Retina/Retina Service, Wills Eye Hospital. DISCLOSURES: Dr. Pandit and Hsu have no relevant financial relationships to disclose. |
A 39-year-old white female with no significant medical history presented with a complaint of increasing photopsias of both eyes for the previous two weeks. She received the first dose of her COVID-19 vaccine three weeks before the onset of ocular symptoms.
One week after she received the vaccination and two weeks before she came to the eye clinic, she developed viral-like symptoms of congestion, rhinorrhea and sore throat. She otherwise denied having a headache, fever, chills, joint aches, paresthesia or skin rashes. She was sexually active with only her husband.
Clinical work-up and imaging
Vision on presentation was 20/20 in both eyes. Intraocular pressure was 12 mmHg in both eyes and the anterior exam was
unremarkable without cell or flare. The dilated fundus examination was significant for rare vitreous cell and multifocal hypopigmented plaques scattered throughout the macula and along the vascular arcades OU.
The optic nerves appeared normal with no evidence of disc edema, and the vasculature was normal without sheathing. No hemorrhages were noted in the periphery (Figure 1).
A targeted systemic work-up was unremarkable, including a quantiferon TB gold assay, syphilis immunoglobulin G antibody with reflex rapid plasma reagent and angiotensin converting enzyme, lysozyme, and an anteroposterior chest X-ray. Magnetic resonance imaging of the brain was deferred because her mini-mental status examination was normal and she had no neurologic deficits on examination.
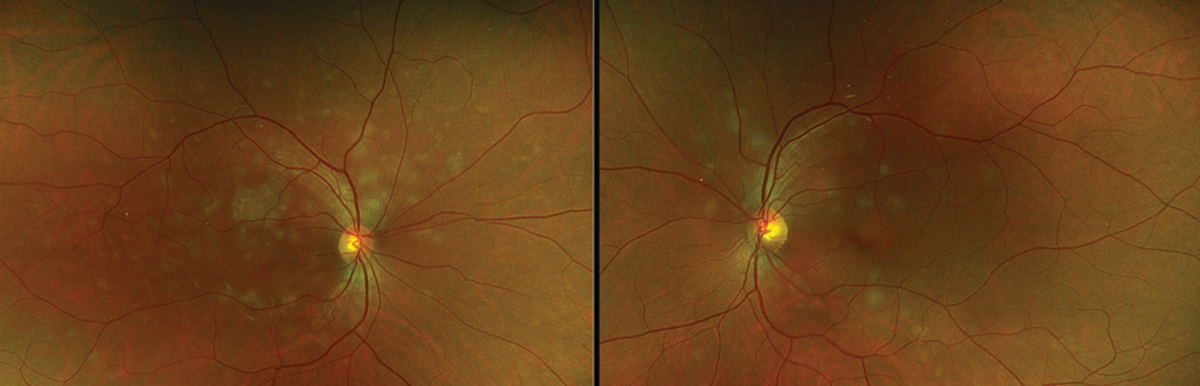 |
| Figure 1. At the initial presentation, color fundus photos of both eyes demonstrate hypopigmented plaques within the macula and along the arcades. |
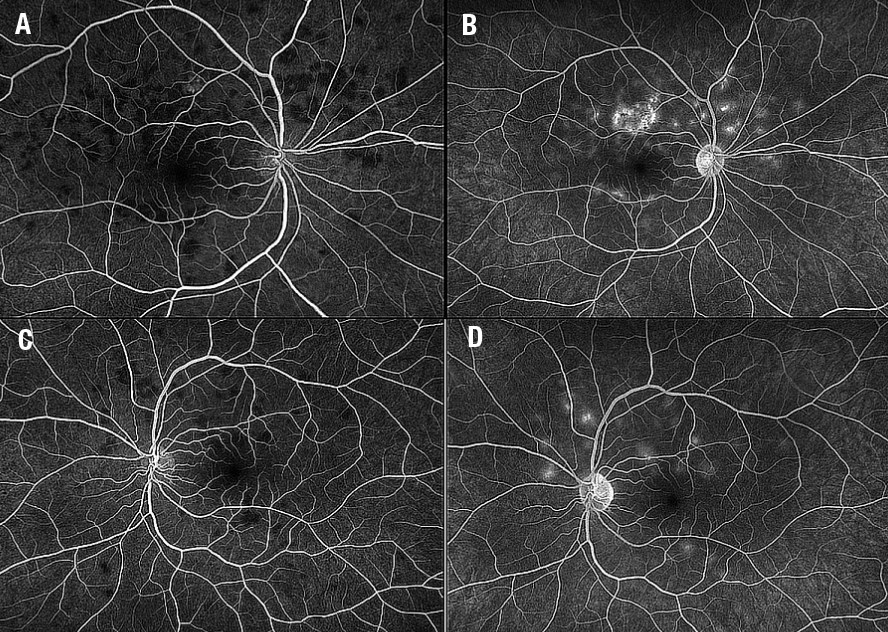
Multimodal imaging of both eyes at presentation demonstrated globular hypoflourescent lesions on indocyanine green angiography with colocalizing optical coherence tomography angiography flow voids in the choriocapillaris (Figure 2).
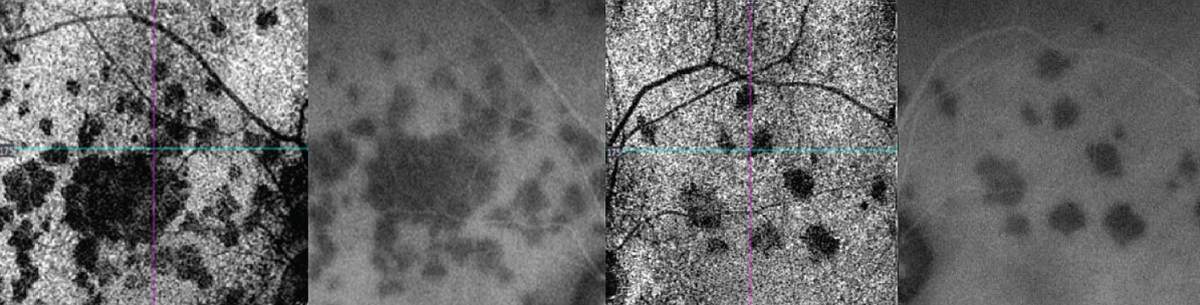 |
| Figure 2. En-face choriocapillaris slabs on optical coherence tomography angiography demonstrate hypointense clustered lesions corresponding to areas of hypocyanescence on indocyanine green imaging. The correlation between the ICG and the OCTA slabs is excellent, which demonstrates choroidal changes in excess of what’s seen on the fundus photo. |
OCT through the superior right macula highlighted retinal pigment epithelial atrophy, ellipsoid zone loss and outer nuclear layer thinning (Figure 3). OCT of the left macula through an active lesion demonstrated hyper-reflectivity of the ONL with underlying EZ attenuation (Figure 3, green arrow).
Fundus autofluorescence showed hypoautofluorescent lesions with edges of hyperautofluorescence, more prominent in the right eye than the left (Figure 4). Intravenous fluorescein angiography demonstrated classic early blocking with late hyperfluorescent lesions (Figure 5).
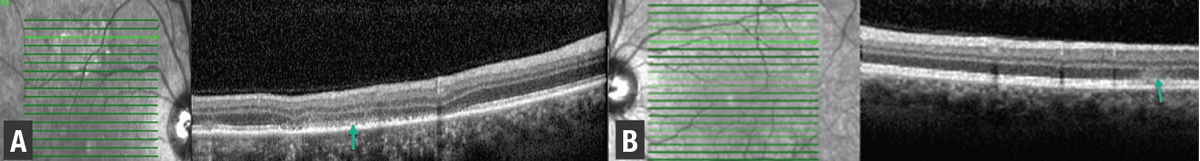 |
| Figure 3. Spectral-domain optical coherence tomography of the right eye (A) shows areas of ellipsoid zone and retinal pigment epithelium (green arrow) disruption, while left eye scans (B) superior to the fovea demonstrate hyperreflectivity in the outer nuclear layer with underlying EZ attenuation (green arrow). |
Additional work-up and treatment
We started the patient on 1 mg/kg oral prednisone (total of 50 mg) for the treatment of presumed acute posterior multifocal placoid pigment epitheliopathy (APMPPE). We tapered the steroids over three weeks.
On repeat examination two weeks later, the patient’s vision remained at 20/20 and her floaters subsided. The plaque-like lesions were less prominent on fundus examination. OCTA demonstrated near complete resolution of flow voids within the choriocapillaris.
 |
| Figure 4. Fundus autofluorescence of the right and left eyes demonstrate corresponding areas of hypoautofluorescent superior to the fovea in the right eye and in the left eye bilateral multifocal hyperautofluorescent areas, which are fewer in quantity compared to the fundus photo. |
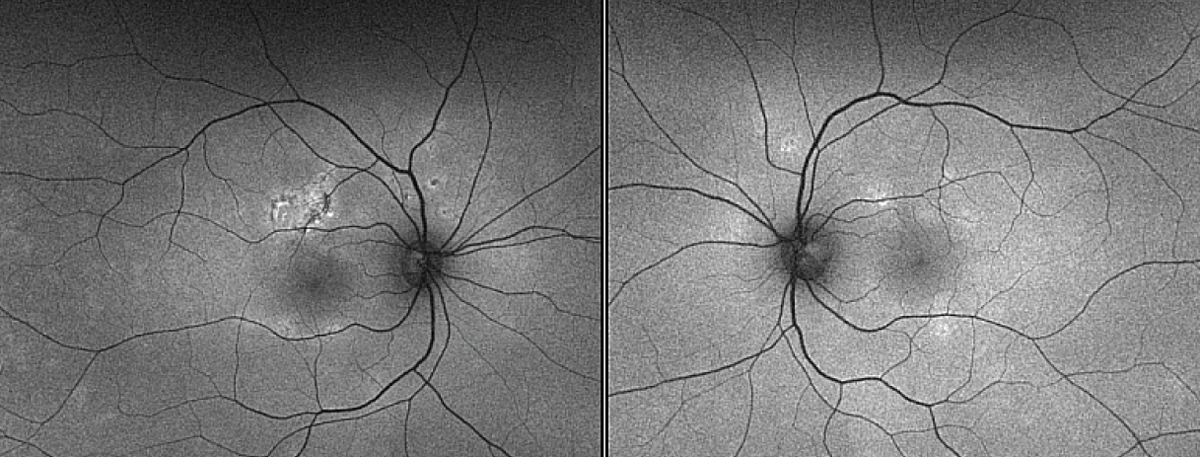
Five weeks after the initial presentation, the patient’s fundus lesions resolved clinically with progressive RPE changes in the right eye only. OCT demonstrated persistent RPE thickening with overlying EZ loss in the right eye superior to the fovea. The remainder of the cube in the right and left eyes demonstrated EZ reconstitution and resolution of ONL hyper-reflectivity with trace ONL thinning. OCTA flow dramatically improved in the left eye, but with a few focal deficits within the macula that correlated to hypofluorescent spots on same-day ICG imaging (Figure 6).
Features of APMPPE
APMPPE is an inflammatory chorioretinopathy, with an estimated incidence of 0.15 cases per 100,000 people.1 It typically presents between the second and fourth decades of life, affects men and women equally and can be associated with systemic conditions, most notably cerebral vasculitis.2 Visual symptoms such as paracentral and central scotomas, photopsias and metamorphopsi, may occur. Approximately a third of patients will present with viral or flu-like illness before visual symptoms arise in APMPPE.2 There have also been reports of development of APMPPE postvaccine.3
The disease is usually self-limiting, with resolution typically occurring between four to six weeks, but it occasionally can take months to resolve. While most patients will have full visual recovery, a retrospective review of 183 patients with APMPPE demonstrated that approximately 25 percent will have a final visual acuity of 20/50 or worse, with foveal involvement conferring a worse visual prognosis.3 Given its association with cerebral vasculitis and other neurologic conditions, a full neurologic evaluation and neuroimaging should be considered in patients suspected of having APMPPE.
 |
| Figure 5. Intravenous fluorescein angiography shows early (A) blocking and late (B) staining in the right eye with similar findings in the left eye (C, D). |
Pathogenesis of APMPPE
Currently, two theories regarding the pathogenesis of APMPPE prevail. The first, which J. Donald M. Gass, MD, proposed, suggested inflammation of the RPE and outer retina, characterized by the placoid lesions seen on examination during the acute phase of disease.4 The second, by E. Michael Van Buskirk, MD, proposed that choroidal vasculitis was the cause of the placoid lesions.5,6
In active disease, IVFA will demonstrate hypofluorescent lesions, which are thought to represent masking of the choroidal fluorescence by the inflamed RPE and resultant blocking. In later phases of the study, these lesions then become hyperfluorescent. ICGA demonstrates early and late hypocyanescence due to poor perfusion to the choriocapillaris.
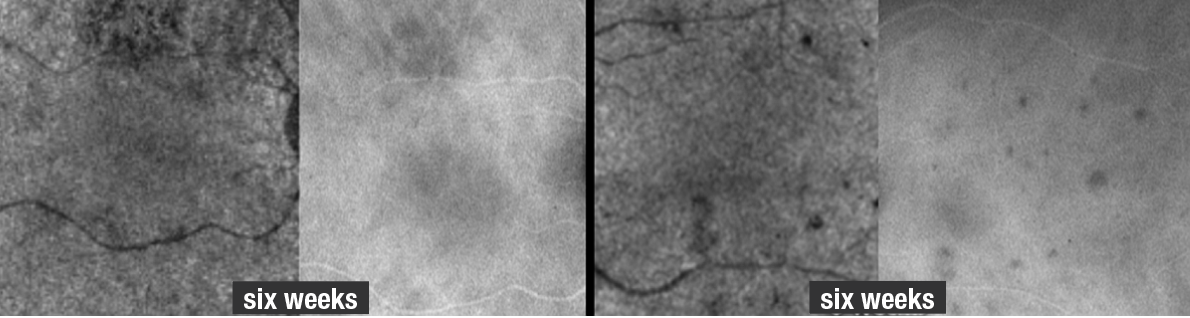 |
| Figure 6. Optical coherence tomography angiography and indocyanine green angiography of the right and left eyes six weeks after the initial presentation show the lesions had significantly improved but haven’t resolved (compare to Figure 2 for OCTA and ICGA images on initial presentation). A few more spots appear on ICG relative to the OCTA at six weeks, but the extent of improvement can be adequately visualized by both imaging modalities. |
On FAF, lesions typically are hypoautofluorescent at the center with edges of hyperautofluorescence. OCT typically demonstrates hyper-reflectivity of the retinal layers from the outer plexiform layer to the RPE, with attenuation or disruption of the ellipsoid zone in some cases.2
A series of five APMPPE cases evaluated with OCTA revealed choriocapillaris flow abnormalities underlying acute and healed APMPPE lesions.7 Acute lesions demonstrated significant loss of choriocapillaris flow while healed lesions showed distinct small-vascular flow channels with intervening no-flow zones, which appeared different compared to surrounding unaffected zones of the choriocapillaris. In addition, a prospective case series demonstrated that OCTA, in comparison to IVFA and ICGA, was able to more clearly distinguish and monitor APMPPE and related placoid disorder lesions.8
Bottom line
As this case illustrates, multimodal imaging is essential in diagnosing APMPPE and monitoring disease activity. The findings in our patient corroborate what has been previously reported: that is, excellent colocalization of flow voids on OCTA with hypocyanescent changes on ICGA. Additionally, we longitudinally followed the lesions with OCTA, observing resolution of these flow voids. A repeat ICGA and OCTA six weeks after this patient’s initial presentation demonstrated significant improvement of the flow voids, but not complete normalization.
Even several weeks after the symptoms and clinical signs resolved, deficits in choroidal perfusion remained—easily imaged with OCTA and ICGA. Here, OCTA may be a suitable and noninvasive way to image patients with APMPPE and track their disease course over time. RS
REFERENCES
1. Abu-Yaghi NE, Hartono SP, Hodge DO, Pulido JS, Bakri SJ. White dot syndromes: A 20-year study of incidence, clinical features, and outcomes. Ocul Immunol Inflamm. 2011:19:426-430.
2. Oliveira MA, Simao J, Martins A, Farinha C. Management of acute posterior multifocal placoid pigment epitheiolopathy (APMPPE): Insights from multimodal imaging with OCTA. Case Rep Ophthalmol Med. 2020:2020;7049168.
3. Comu S, Verstraeten T, Rinkoff JS, Busis NA. Neurological manifestations of acute posterior multifocal placoid pigment epitheliopathy. Stroke. 1996:27:996-1001.
4. Gass JD. Acute posterior multifocal placoid pigment epitheliopathy. Arch Ophthalmol. 1968;80:177-185.
5. Deutman AF, Oosterhuis JA, Boen-Tan TN, Aan de Kerk AL. Acute posterior multifocal placoid pigment epitheliopathy. Pigment epitheliopathy of choriocapillaritis? Br J Ophthalmol. 1972; 56:863–874.
6. Van Buskirk EM, Lessel S, Frieman E. Pigment epitheliopathy and erythema nodosum. Arch Ophthalmol. 1971;85:369–372.
7. Heiferman MJ, Rahmani S, Jampol LM, et al. Acute posterior multifocal placoid pigment epitheliopathy on optical coherence tomography angiography. Retina. 2017;37:2084-2094.
8. Klufas MA, Phasukkijwatana N, Iafe NA, et al. Optical coherence tomography angiography reveals choriocapillaris flow reduction in placoid chorioretinitis. Ophthalmol Retina. 2017;1:77-91.