New Insights in Imaging
Take-home points
|
 |
|
Bio Dr. Lim is the Marion H. Schenk Esq. Chair and UIC Distinguished DISCLOSURES: Dr. Lim disclosed financial relationships with Genentech/Roche, Regeneron Pharmaceuticals, Opthea, Cognition, Viridian, Santen, Quark, Luxa, Aura, Alimera, Unity, Eyenuk, Aldeyra, NGM, Adverum, Regenexbio, Janssen, Spring Vision, Iveric Bio and EyePoint Pharmaceuticals. |
Diabetes mellitus is known to induce neurovascular changes that result in structural abnormalities and functional losses before the onset of clinically visible diabetic retinopathy. Optical coherence tomography and OCT angiography reveal subclinical changes. Psychophysical testing uncovers functional losses in DM eyes without DR eyes. DM eyes with early DR demonstrate more neurovascular changes and corresponding functional abnormalities than DM eyes without DR.
This article will discuss the structural OCT changes in the early stages of DR, in eyes of DM patients without DR and those with mild nonproliferative DR.
Experimental diabetic animal models as well as human histopathology specimens reveal that neuroglial degeneration with resultant reactive gliosis and neural-cell apoptosis occur in DR.1-3 In diabetic retinas, retinal ganglion cells and amacrine cells undergo diabetes-induced apoptosis early in the disease process. Photoreceptors are also affected early on. The loss of these cells manifests as retinal thinning of the inner retinal layers and the retinal nerve fiber layer.
OCT imaging scans contain not only structural but also reflectivity information about the health of the retinal layers. The OCT images can be used to compare subclinical structural and reflectivity changes of eyes in patients with diabetes with non-diabetes normal controls. In some DM eyes, retinal thickening, due to ischemia and vascular endothelial growth factor output, can also result even before visibly detectable edema.
Studies of retinal thickness changes
Several OCT studies have examined the retinal thickness of patients with type 1 and type 2 DM. An OCT study in 2004 compared the retinal and RNFL thickness measurements of 32 adult patients with type 2 DM without DR to 48 retinal controls and to 34 RNFL controls in the temporal, superior, nasal and inferior retinal quadrants. This was one of the first studies to show that retinal thickness was significantly increased (p=0.03) and RNFL thickness was significantly decreased (p=0.02) in the superior retinal areas of DM without DR compared with controls.4 Subsequently, many other studies also looked at the structural retinal thickness changes.
Studies found changes also occurred in children with DM. An OCT study compared scans of 60 children with type 1 DM but without DR to 60 normal age-matched controls without DM to evaluate the ganglion cell-inner plexiform layer (GC-IPL) and RNFL thicknesses. This study revealed thinning of the GC-IPL thickness in all quadrants except the superior-nasal quadrant (p < 0.05) and no difference in the RNFL thickness in all quadrants between the groups (p<0.05).5
Another study compared adolescents with type 1 and type 2 DM without DR, finding that the RNFL was disproportionately affected compared with the total retinal thinning for both groups. This study also found type 2 DM patients were more affected than type 1 DM patients with regard to the thickness of the retinal layers as well as reflectivity of the retinal layers seen on OCT.
Further evidence of structural changes
A more recent OCT study compared 30 patients with DM but without DR and 44 with NPDR with controls. The researchers found a significant increase of inner plexiform layer and inner nuclear layer (INL) thicknesses in DR eyes (p<0.001) and a significant decrease (p<0.01) of RNFL layers as well as specific sites of retinal GCL layer (p=0.02) in the macula. They found no differences in the peripapillary area between DM patients and controls.7
Another study of 102 patients compared 46 DM patients without DR and 28 with mild NPDR with 28 controls. Quantitative analysis showed that the mean GCL and mean RNFL layers were thinner in the DM patients without DR than in controls. The mild NPDR eyes demonstrated significant retinal thinning compared to controls (p=0.032) and thinner RNFL and GCL.8
The en face OCT maps can show these differences between controls and DM without DR patients. RNFL thinning and thickening of the outer nuclear layer (ONL) occur in eyes of patients with DM but without DR. These studies are similar to previous studies that found peripheral RNFL thinning in DM with no or minimal DR.
Locational changes
More recent studies have focused on the location of the neurodegenerative changes in patients with minimal DR. Quantitative analysis revealed the pericentral area of the macula shows thinning in the RNFL, GCL and IPL in patients with minimal DR vs. controls (respective difference = 1.9 µm, 95% confidence interval [CI] 0.3-3.5 µm; 5.2 µm, 95% CI 1.0-9.3 µm; and 4.5 µm, 95% CI 2.2-6.7 µm respectively).
In the peripheral macula, the RNFL and IPL layers were also thinner in patients with minimal DR vs. controls (respective difference 3.2 µm, 95% CI 0.1-6.4 µm; 3.3 µm, 95% CI 1.2-5.4 µm). Multiple linear regression analysis showed DR status to be the only significant explanatory variable (r=0.31, p = 0.03) for this retinal thinning. 9
Longitudinal studies have documented that the neuroretinal thickness loss (RNFL, GCL, IPL) in DM without DR or with minimal DR is about 0.54 µm per year (loss of 0.25 µm/yr in the NFL and loss of 0.29 µm/yr in the GCL). This translates to a significant loss of 5.4 µm over 10 years, similar to that in severe glaucoma, although perhaps more diffuse than the scotomas found in glaucoma.2 Research on streptozotocin-induced type 1 DM mice has documented that neurodegenerative changes precede microvascular changes, implicating a primary neuronal degenerative process in DR.2
OCT retinal reflectively
The OCT scan can also be analyzed by the intensity of hyperreflective and hyporeflective bands. Typically, hyperreflective bands occur at interface junctions and hyporeflective bands at nuclear layers. The retina can be split into the inner retina, ranging from the ILM to the INL, and the outer retina, extending from the OPL/ONL to the RPE.
The ILM is the first hyperreflective line on OCT and depicts the vitreous-retinal interface border. The RNFL is the hyperreflective band at the temporal edge of the optic disc and extends toward the fovea, sitting above the hyporeflective ganglion cell layer (GCL). Below the GCL is the IPL, which, with the outer plexiform layers, form the other hyperreflective lines of the inner retina. The INL is the hyporeflective band sandwiched between these two hyperreflective lines.
The outer retina extends from the ONL to the retinal pigment epithelium. The outer retina has four hyperreflective lines, traditionally thought of as the external limiting membrane, ellipsoid zone, interdigitation and the RPE band. The ELM is the hyperreflective line formed by junctional complexes between Müller cells and photoreceptor inner segments. The second outer band corresponds to the inner-segment ellipsoid and the third band to the interdigitation zone, according to the 2014 International OCT Nomenclature Meeting.10
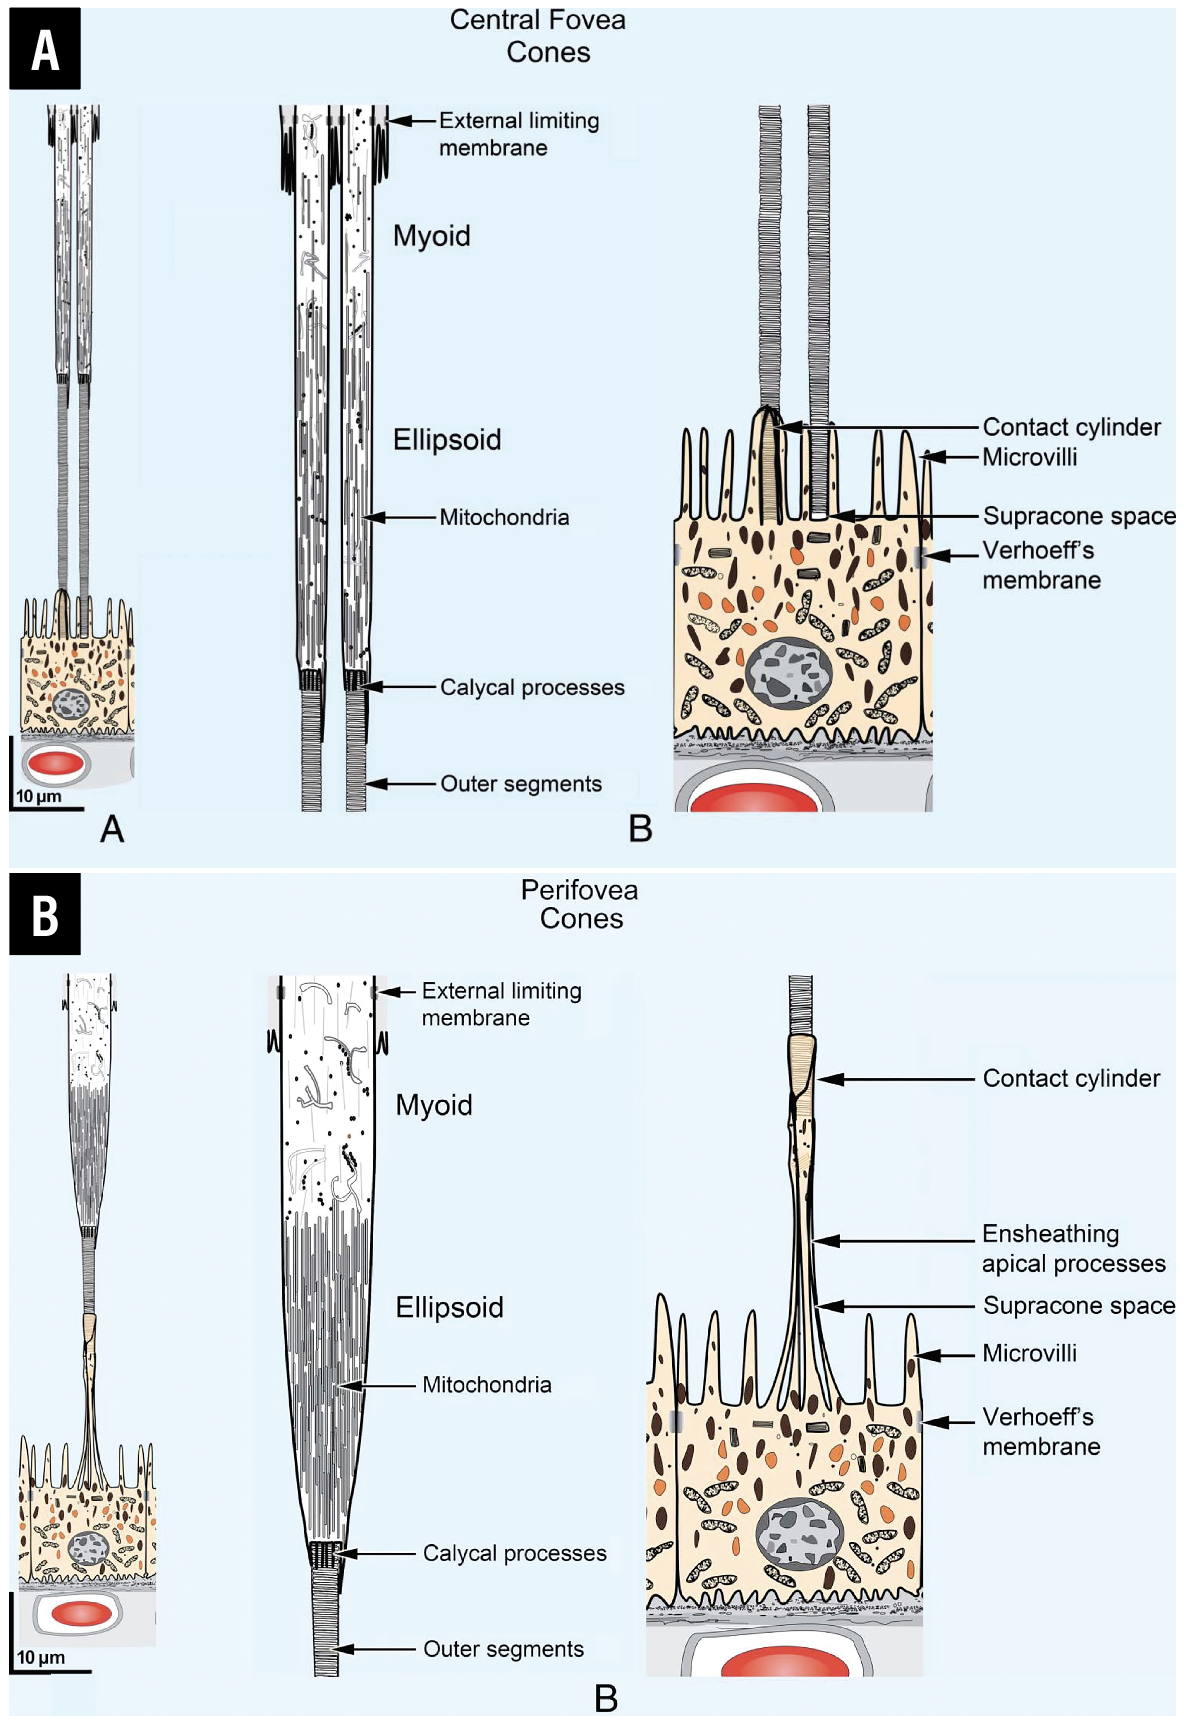 |
| Figure 1. Rendering of photoreceptor structure within the retina highlights the location of the mitochondria in the inner-segment ellipsoid of the photoreceptors. Scale drawings are of the outer retina at central foveal (A) and perifoveal (B) regions. Images on the left are low-magnification illustrations. Images in the center are high-magnification illustrations in two parts of the anatomically correct model. (From Yao X, Son T, Kim TH, Le D. Interpretation of anatomic correlates of outer retinal bands in optical coherence tomography. Exp Biol Med (Maywood). 2021;246:2140-2150. Modified with permission from Spaide RF, Curcio CA. Anatomical correlates to the bands seen in the outer retina by optical coherence tomography: literature review and model. Retina 2011;31:1609–1619. Used with permission). |
Hyperreflective RPE band
The RPE band may appear as two distinct hyperreflective bands, especially when pathology is present and Bruch’s membrane (2-to-4- µm thick acellular matrix) is separated from the RPE. More recently, Xincheng Yao, PhD, and colleagues at the University of Illinois at Chicago redefined the second ORL hyperreflective band as inner-segment ellipsoid and inner-segment/outer-segment junction and connecting cilium and the third band as an amalgam of outer segment, outer-segment tip and RPE apical processes (Figure 1, above).11
DR stage has been shown to affect the intensity of the retinal hyperreflective lines. INL intensity (p<0.04) has been shown to be higher in all macular subfields in NPDR eyes compared with controls (p<0.04).13 Thus, reflectance, along with depth and spatially resolved measurements of retinal thickness, is a potential biomarker for monitoring DR development, progression and response.12 Reflectance from these layers and the distances between the reflective outer bands can be used as a surrogate for the photoreceptor lengths.13
Mitochondria-rich inner segment
Retinal photoreceptors harbor 75 percent of the retinal mitochondria, which is mainly located in the inner-segment ellipsoid zone. The photoreceptor layer is the most metabolically active retinal component and accounts for 75 percent of the retinal oxygen consumption.14-16 This inner-segment ellipsoid is rich in mitochondria and mitochondria scatter light. In retinal diseases, the inner-segment myoid decreases in length and mitochondria move inward. Diseased mitochondria undergo fission resulting in smaller mitochondria and more scattering of light and reduced reflectivity.17 Thus, the reflectivity of the OCT outer retinal bands contain information about photoreceptor health.
Disease states have been reported to result in qualitative changes.11 The ELM, because it’s formed by junctional complexes between Müller cells and photoreceptor inner segments, has traditionally been considered a biomarker of photoreceptor integrity.
Researchers have shown that inner-segment ellipsoid reflectivity (absolute and relative) is lower in mild NPDR eyes compared with controls (p<0.001), while the reflectivity of the RPE and ELM didn’t differ (p = 0.126; p=0.053).18 Indeed, in DM-without-DR eyes, the GCL and INL reflectivity changes occurred and correlated with the severity of the retinal layer thickness changes more so than with control eyes.
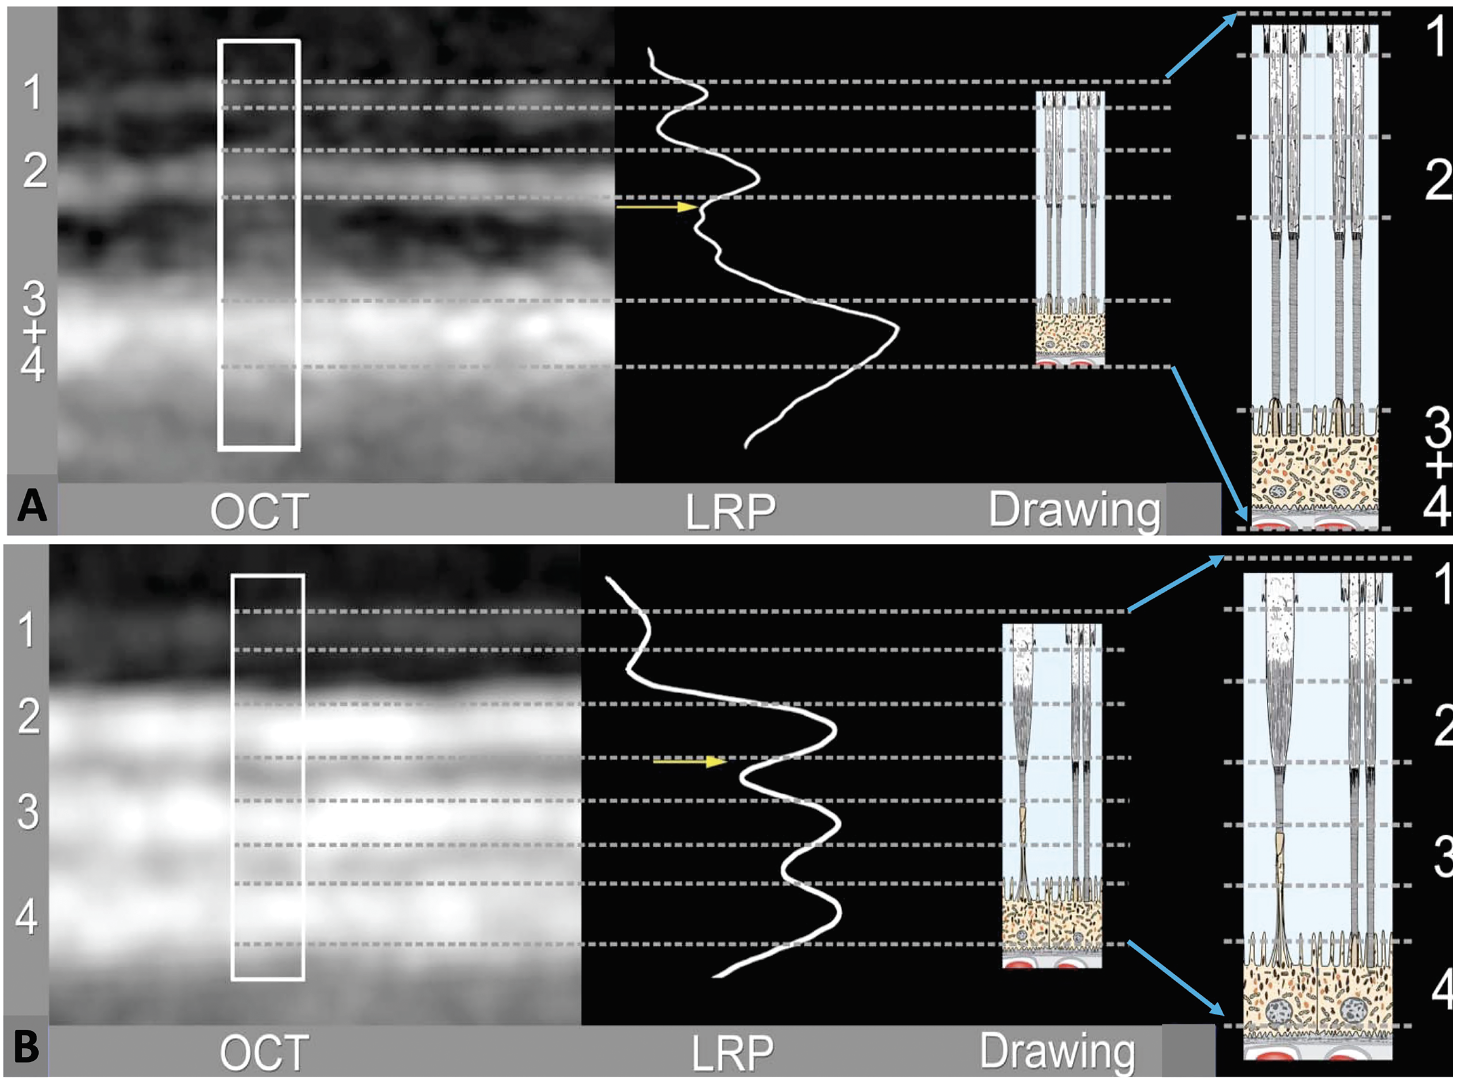 |
| Figure 2. Optical coherence tomography reflectance profiles aligned with the retinal structures show comparative alignment of clinical OCT bands with the anatomically correct model at the central foveal (A) and perifoveal (B) regions. (From Yao X, Son T, Kim TH, Le D. Interpretation of anatomic correlates of outer retinal bands in optical coherence tomography. Exp Biol Med (Maywood). 2021;246:2140-2150. Modified with permission from Spaide RF, Curcio CA. Anatomical correlates to the bands seen in the outer retina by optical coherence tomography: literature review and model. Retina 2011;31:1609–1619. Used with permission.) |
ORL band distances
Recently, our group compared outer retinal band reflectance and ORL band distances in DM-without-DR and DM-with-early DR eyes with non-DM control eyes.13 Because the distances between the outer bands vary across macula—fovea to parafovea to perifovea—these areas were analyzed separately for comparisons of the DM eyes to control eyes. The study compared reflectivity of the ELM, inner-segment ellipsoid and interdigitation zone and RPE layers, and the distances between the ELM to inner-segment ellipsoid, inner-segment ellipsoid to interdigitation zone and interdigitation to RPE (Figure 2).
We noted differences in reflectivity and distance between the outer hyperreflective bands in the controls and the DM-without-DR and mild NPDR eyes (Figure 3). Inner-segment ellipsoid reflectivity decreased progressively while RPE reflectivity increased progressively with disease progression from controls to DM-without-DR and to mild NPDR.
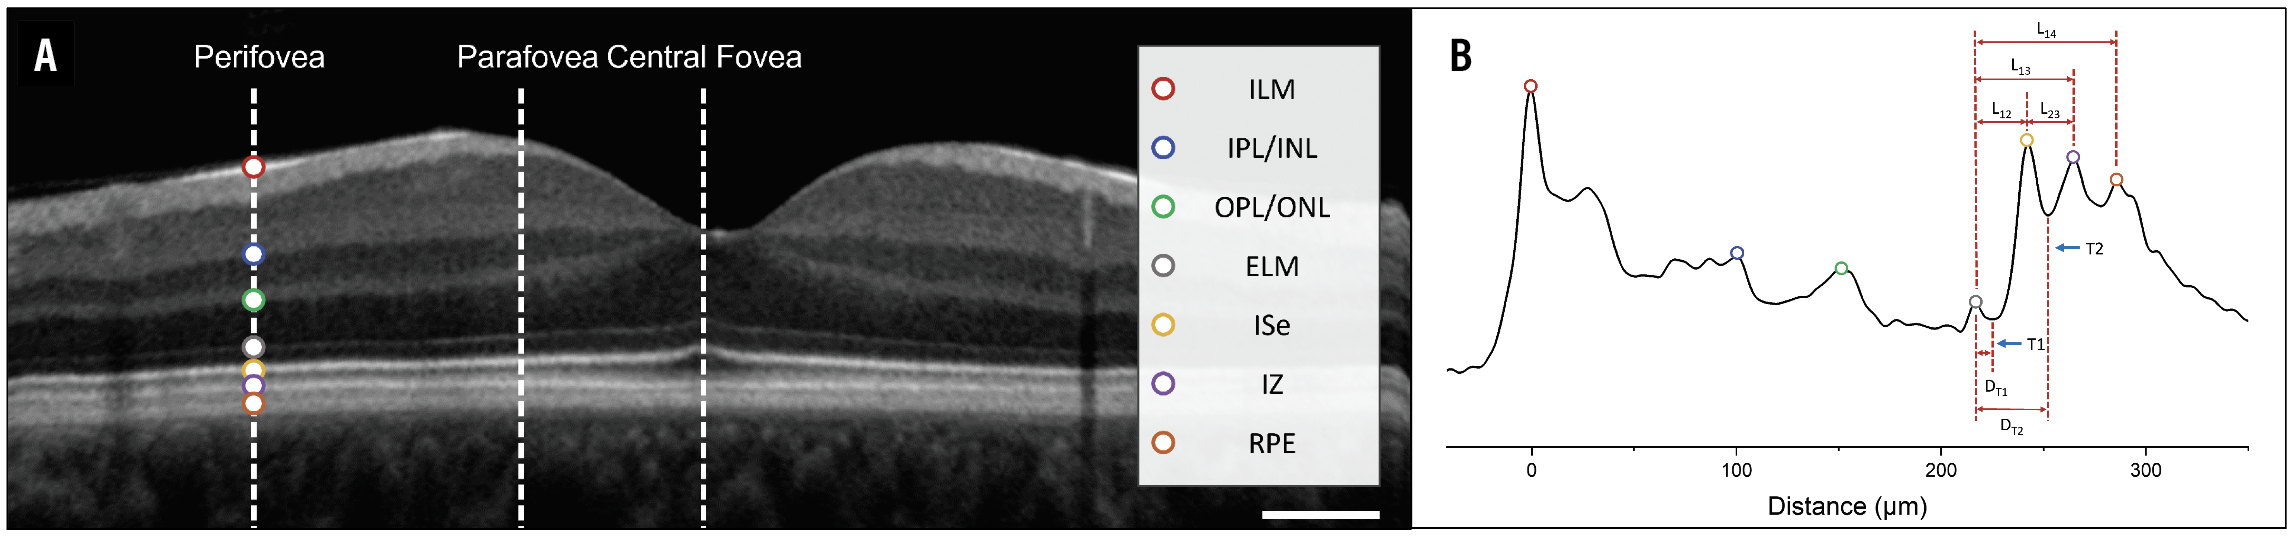 |
| Figure 3. Diagrams of the reflectance intensity of the outer retinal bands and the location of the distance measurements between the reflectance bands. A) A representative optical coherence tomography B-scan of a healthy control subject. The dashed white lines represent eccentricities for A-line analysis. The colored markers represent retinal locations, with the corresponding band location summarized in the legend. B) Representative averaged A-line profile of the perifovea to illustrate individual retinal locations and outer retina thickness measurements. Key: D12,distance from the external limiting membrane to inner-segment ellipsoid; D13, distance from the ELM to interdigitation zone; D23, distance from the inner-segment ellipsoid to the interdigitation zone; D14, distance from the ELM to the retinal pigment epithelium; D1T1, distance from the ELM to T1; and D1T2, distance from the ELM to T2. The scale bar represents 0.5 mm. (From Le D, Son T, Lim JI, Yao X. Quantitative optical coherence tomography reveals rod photoreceptor degeneration in early diabetic retinopathy. Retina 2022;42:1442-1449. Used with permission.) |
A ratio of normalized inner-segment ellipsoid/RPE intensity showed a significant decreasing trend in the perifoveal zone, but no detectable difference in the central fovea. This suggests a rod-predominant photoreceptor abnormality in early DR.
We also found differences in the distance between the inner-segment ellipsoid and interdigitation zone for controls and mild DR in the central (p<0.005), parafovea (p=0.044) and perifoveal zones (p=0.036). This distance was significantly different between DM-without-DR and mild NPDR eyes for the perifoveal zone (p=0.039). The inner-segment ellipsoid-to-interdigitation zone distance correlated with outer photoreceptor length, suggesting photoreceptor abnormalities in early DR.
Functional abnormalities, including electroretinogram20-22 and contrast sensitivity23 findings, accompany these anatomic abnormalities. Thus, neurovascular dysfunction occurs early in DM without DR and in minimal to mild DR eyes before other abnormal OCT findings develop.
Bottom line
OCT imaging contains information about photoreceptor health and can detect abnormalities in eyes with DM but without DR as well as early DR. OCT can be helpful in detecting the earliest manifestations of neurovascular dysfunction in these eyes. As preventive therapeutics become available, OCT imaging will enable us to target eyes at higher risk of progression to clinically evident DR. RS
REFERENCES
1. Barber AJ, Lieth E, Khin SA, Antonetti DA, Buchanan AG, Gardner TW. Neural apoptosis in the retina during experimental and human diabetes. Early onset and effect of insulin. J Clin Invest. 1998;102:783–791.
2. Sohn EH, van Dijk HW, Jiao C, et al. Retinal neurodegeneration may precede microvascular changes characteristic of diabetic retinopathy in diabetes mellitus. Proc Natl Acad Sci U S A. 2016;113:E2655-E2664.
3. Eisma JH, Dulle JE, Fort PE. Current knowledge on diabetic retinopathy from human donor tissues. World J Diabetes. 2015;6:312-320.
4. Sugimoto M, Sasoh M, Ido M, Wakitani Y, Takahashi C, Uji Y: Detection of early diabetic change with optical coherence tomography in type 2 diabetes mellitus patients without retinopathy. Ophthalmologica. 2005;219:379-385.
5. Karti O, Nalbantoglu O, Abalı S, et al. Retinal ganglion cell loss in children with type 1 diabetes mellitus without diabetic retinopathy. Ophthalmic Surg Lasers Imaging Retina. 2017;48:473-477.
6. Bronson-Castain KW, Bearse MA Jr, Neuville J, et al. Early neural and vascular changes in the adolescent type 1 and type 2 diabetic retina. Retina. 2012;32:92-102.
7. Vujosevic S, Midena E. Retinal layers changes in human preclinical and early clinical diabetic retinopathy support early retinal neuronal and Muller cells alterations. J Diabetes Res. 2013;2013:905058.
8. Rodrigues EB, Urias M, Penha FM, et al. Diabetes induces changes in neuroretina before retinal vessels: A spectral-domain optical coherence tomography study. Inter J Retina Vit. 2015;1:4.
9. van Dijk HW, Verbraak FD, Kok PH, et al. Early neurodegeneration in the retina of type 2 diabetic patients. Invest Ophthalmol Vis Sci. 2012; 53: 2715–2719.
10. Staurenghi G, Sadda S, Chakravarthy U, Spaide RF, International Nomenclature for Optical Coherence Tomography (IN-OCT) Panel. Proposed lexicon for anatomic landmarks in normal posterior segment spectral-domain optical coherence tomography: The In OCT consensus. Ophthalmology. 2014; 121:1572-1578.
11. Yao X, Son T, Kim TH, Le D. Interpretation of anatomic correlates of outer retinal bands in optical coherence tomography. Exp Biol Med (Maywood). 2021;246:2140-2150.
12. Wanek J, Blair NP, Chau FY, Lim JI, Leiderman YL, Shahidi M. Alterations in retinal layer thickness and reflectance at different stages of diabetic retinopathy by en face optical coherence tomography. Invest Ophthalmol Vis Sci. 2016;57:341-7.
13. Le D, Son T, Lim JI, Yao X. Quantitative optical coherence tomography reveals rod photoreceptor degeneration in early diabetic retinopathy. Retina. 2022;42:1442-1449.
14. Miller DJ, Cascio MA, Rosca MG. Diabetic retinopathy: The role of mitochondria in the neural retina and microvascular disease. Antioxidants. 2020; 9:905.
15. Giacco F, Brownlee M. Oxidative stress and diabetic complications. Circ Res. 2010;107:1058-1070.
16. Green DR, Amarante-Mendes GP. The point of no return: Mitochondria, caspases, and the commitment to cell death. In: Kumar S, ed. Apoptosis: Mechanisms and Role in Disease. Results and Problems in Cell Differentiation, vol 24. Berlin Heidelberg: Springer; 1998: 45-61.
17. Litts, Katie M et al. Optical coherence tomography and histology of age-related macular degeneration support mitochondria as reflectivity sources. Retina 2018:38:445-461.
18. Toprak I, Yildirim C, Yaylali V. Impaired photoreceptor inner segment ellipsoid layer reflectivity in mild diabetic retinopathy. Can J Ophthalmol. 2015;50:438-441.
19. Cetin EN, Parca O, Akkaya HS, Pekel G. Association of inner retinal reflectivity with qualitative and quantitative changes in retinal layers over time in diabetic eyes without retinopathy. Eye (Lond). 2022;36:1253-1260.
20. Holopigian K, Greenstein VC, Seiple W, et al. Evidence for photoreceptor changes in patients with diabetic retinopathy. Invest Ophthalmol Vis Sci. 1997;38:2355–2365.
21. McAnany JJ, Park JC. Cone photoreceptor dysfunction in early-stage diabetic retinopathy: Association between the activation phase of cone phototransduction and the flicker electroretinogram. Invest Ophthalmol Vis Sci. 2019;60:64–72.
22. McAnany JJ, Park JC, Chau FY, Leiderman YI, Lim JI, Blair NP. Amplitude loss of the high-frequency flicker electroretinogram in early diabetic retinopathy. Retina. 2019;39:2032-2039.
23. McAnany JJ, Park JC, Lim JI. Visual field abnormalities in early-stage diabetic retinopathy assessed by chromatic perimetry. Invest Ophthalmol Vis Sci. 2023;64:8.