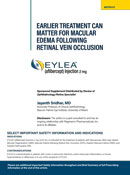
| New Insights in Imaging |
Take-home points
|
 |
|
Bio DISCLOSURE: Dr. Grewal |
Uveitis assessment is complex because of the heterogeneity across the different uveitic phenotypes, and fluctuations with disease severity and flares. This increases the need for a reliable anatomic biomarker to predict disease activity and functional response.
Use of appropriate biomarkers is also imperative in clinical trials. For example, vitreous haze, a commonly used endpoint in uveitis clinical trials, is limited by poor intergrader agreement, even among experts.1 This is important as clinical trial failure may be due to limitations of the endpoint rather than the drug. The Food and Drug Administration mandates a trial endpoint to be “well-defined and reliable,” with treatment benefit being a measure of how a patient functions.
A surrogate uveitic biomarker should thus be “biologically relevant” to the disease pathophysiology, and “functionally relevant” with a quantifiable effect on visual function.2 So, the ideal biomarker would be reliable, noninvasive and easy to acquire in routine clinical practice, with large clinical databases available for validation.
Optical coherence tomography plays a critical role in fulfilling the need for an objective anatomic biomarker because it provides a quantitative way to assess inflammation. Being ubiquitous in modern ophthalmic practices, and often considered as an “ocular vital sign,” OCT is ideally suited to provide structural, noninvasive, repeatable measures.2 Here, we review some of the currently used OCT biomarkers in uveitis.
Uveitic macular edema and central subfield thickness
Uveitic macular edema (UME) is the most important reversible cause of sight-loss in uveitis that’s amenable to pharmacological treatment. The neurosensory retina has a degree of elasticity. Within limits, the continuity of bipolar cells is maintained even with fluid buildup and the connections between the photoreceptor and ganglion cell layers remain viable.
However, if the edema exceeds these elastic limits, bipolar axons snap, irreparably compromising this transmission pathway. This explains why visual acuity may not fully recover to baseline even after UME resolves.3 Features of UME associated with visual acuity include intraretinal cystoid spaces and subretinal fluid (Figure 1). Larger cysts have a greater impact.4
 |
| Figure 1. Optical coherence tomography showing uveitic macular edema with various anatomical parameters that are useful biomarkers, including vitreous hyperreflective dots, hyperreflective foci, intraretinal cysts, subretinal fluid and ellipsoid zone loss. |
Even in the absence of cystoid spaces and SRF, retinal thickness and perivascular thickening are valuable markers of disease activity on OCT.5 “Non-cystic thickening,” which is often monitored using the central subfield thickness, as well as perivascular thickening, can be a valuable continuous marker of disease activity (Figure 2). CST represents an important secondary anatomic endpoint and a component of retreatment criteria in clinical trials for UME.
Elizabeth Sugar, PhD, and colleagues demonstrated that each 100-μm reduction in CST equaled a 6.5-letter increase in visual acuity. A sensitivity analysis suggested that a 20-percent reduction in CST should be used as a clinically meaningful improvement in visual acuity.6 In rare conditions, such as autoimmune retinopathy, macular edema is a biomarker for more severe disease, associated with decreased electroretinogram amplitudes and greater velocity of ellipsoid zone loss.7
Persistent cystoid macular edema may lead to irreversible disruption of the retinal neural network, gliosis or atrophy, and permanent visual acuity loss.4 Early anatomic response based on CST is associated with a greater 24-week improvement in VA compared with those without an early response.8
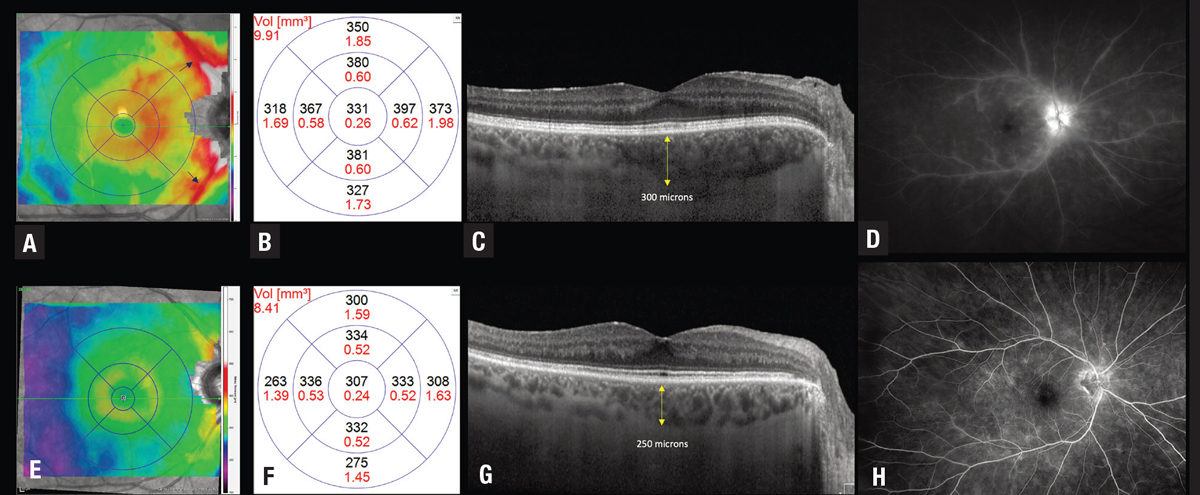 |
| Figure 2. Optical coherence tomography thickness map (A) shows thickening in the macula along with perivascular thickening along the arcades in an eye with active birdshot chorioretinopathy that (D) corresponds to perivascular leakage seen on the fluorescein angiogram. C) OCT shows thickening of the choroid, with a subfield choroidal thickness of 300 µm. After immunomodulatory treatment, the thickness map shows marked reduction in noncystic thickening and perivascular thickening. This corresponds to improved leakage on the fluorescein angiogram, with improvement in central subfield thickness from 331 µm (B) to 307 µm (F) and a reduction in choroidal thickness to 250 µm. |
In the Multicenter Uveitis Steroid Treatment (MUST) trial, visual acuity had a moderate negative correlation with CST at baseline (r=−0.56), and change in VA showed a moderate negative correlation with change in CST at six months (r=−0.46).6 Using data from the Phase III PEACHTREE and AZALEA trials evaluating suprachoroidal triamcinolone in UME, structure-function correlation analyses demonstrated that eyes with center-involving cystoid spaces and subretinal fluid at baseline had greater VA improvement at 24 weeks.
Unique to this investigation, a longitudinal response model using this dataset showed that maximal VA improvement can lag peak anatomical improvement by up to six weeks, which provides valuable information for the temporal structure-function correlation and is very helpful in counseling patients on their timeline for improvement in VA.8
Other uveitic biomarkers
• Integrity of the ellipsoid zone. EZ integrity reflects the anatomic arrangement of photoreceptor outer segments, and has functional correlations in UME. After adjusting for CST and age, EZ integrity has been shown to account for 29 percent of the total variation in visual acuity in UME compared to intraretinal cystoid spaces, which account for 17.4 percent, and SRF, which accounts for 15 percent. Eyes with normal central subfield EZ experience greater improvement in VA. Improvement in EZ status corresponds to greater VA gains.8
• Hyperreflective foci. The presence of HRF in the inner and outer retina is associated with worse VA.4 Whether these also predict poor treatment response is as yet unclear. Mathias Bolz, MD, and colleagues first described HRF as deposits located within the walls of intraretinal microaneurysms and scattered throughout all retinal layers, forming confluent plaques in the outer plexiform layers. These are thought to be inflammatory in origin in uveitis.9,10
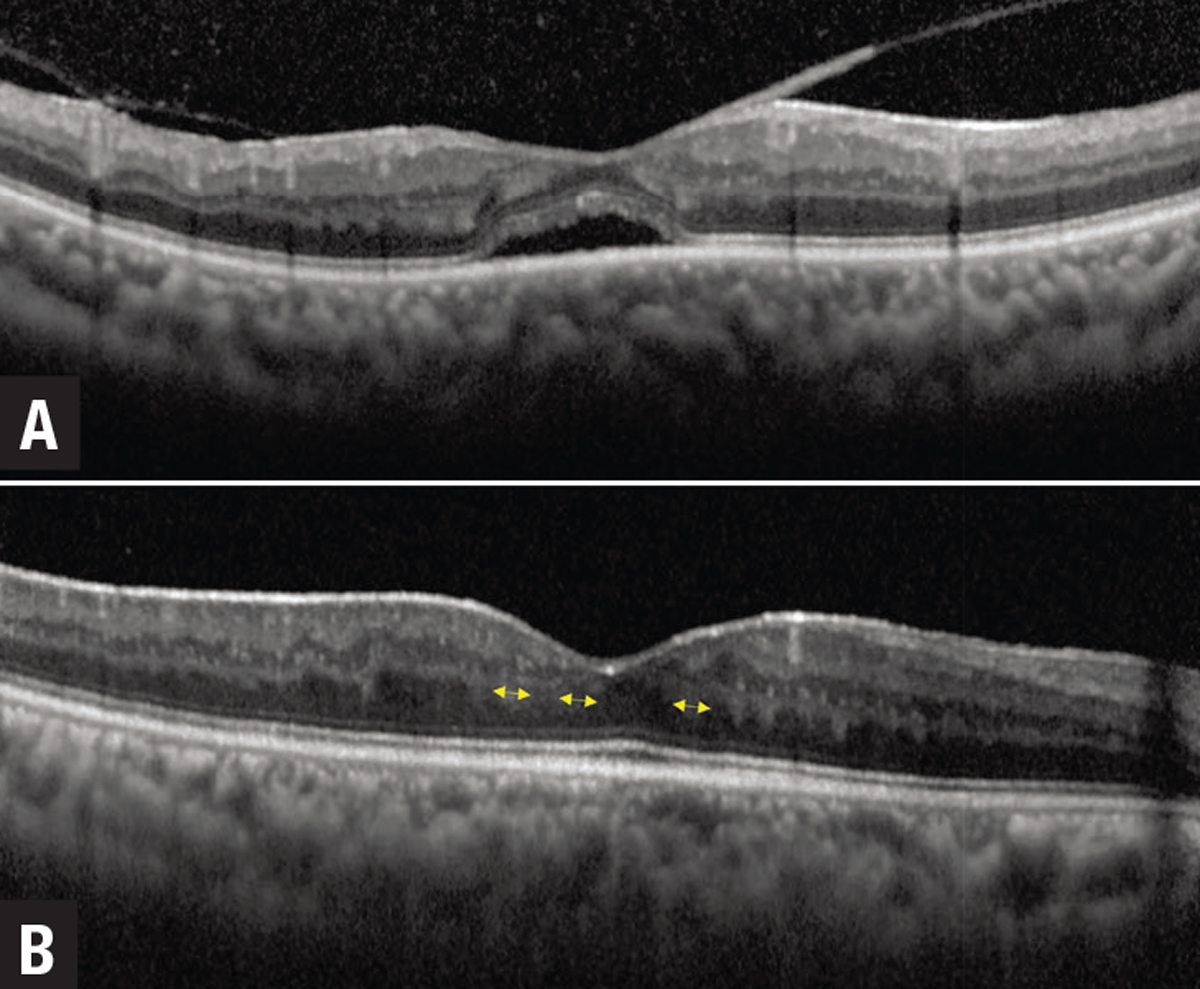 |
| Figure 3. A) Optical coherence tomography showing uveitic macular edema (UME) with subretinal fluid and an overlying epiretinal membrane. Resolution of UME and subretinal fluid occurs after starting treatment. B) However, patches of derangement of the normal laminar inner retinal architecture emerge, which are prognostic for poor long-term visual acuity. |
• Disorganization of retinal inner layers. Known as DRIL, this is defined as derangement of the normal laminar inner retinal structure. This is a robust and easy-to-obtain surrogate marker of VA in UME.4 Foveal DRIL (Figure 3) is associated with worse VA at baseline and follow-up visits. The horizontal and vertical extent of DRIL strongly correlates with worse visual acuity and the association of DRIL with visual acuity is robust across a wide spectrum of UME severity.4 There’s a potential of reversibility with DRIL; improvement in DRIL corresponds to long-term improved visual acuity.
• Anterior chamber cells. Sumit Sharma, MD, and colleagues defined a continuous measure of anterior chamber inflammation as cells per millimeter cubed.11 OCT automated quantification of AC cells may be superior to clinical grading systems, but this still requires significant validation.
• Choroidal biomarkers. Choroidal inflammation due to infiltration of immune cells and their effects on choroidal tissue is considered to reflect an increase in choroidal thickness, which is measured from the retinal pigment epithelium to the choroidal-scleral interface as a hyporeflective band. Choroidal thickness is a useful measurement in the acute stage of stromal choroiditis (i.e., in Vogt-Koyanagi-Harada disease) and for monitoring inflammatory activity.
Metrics such as the choroidal vascularity index (CVI), defined as the ratio of vascular area to the total choroidal area—that is, the percentage of the choroid that is vascular—can also be helpful. An increase in CVI is an indicator of inflammatory activity.12,13 Enhanced-depth OCT imaging of features of choroidal lesions and granulomas, such as lobulated and nonhomogenous internal patterns, can differentiate etiologies such as tuberculosis, sarcoidosis and VKH.
Biomarkers in infectious uveitis
 |
|
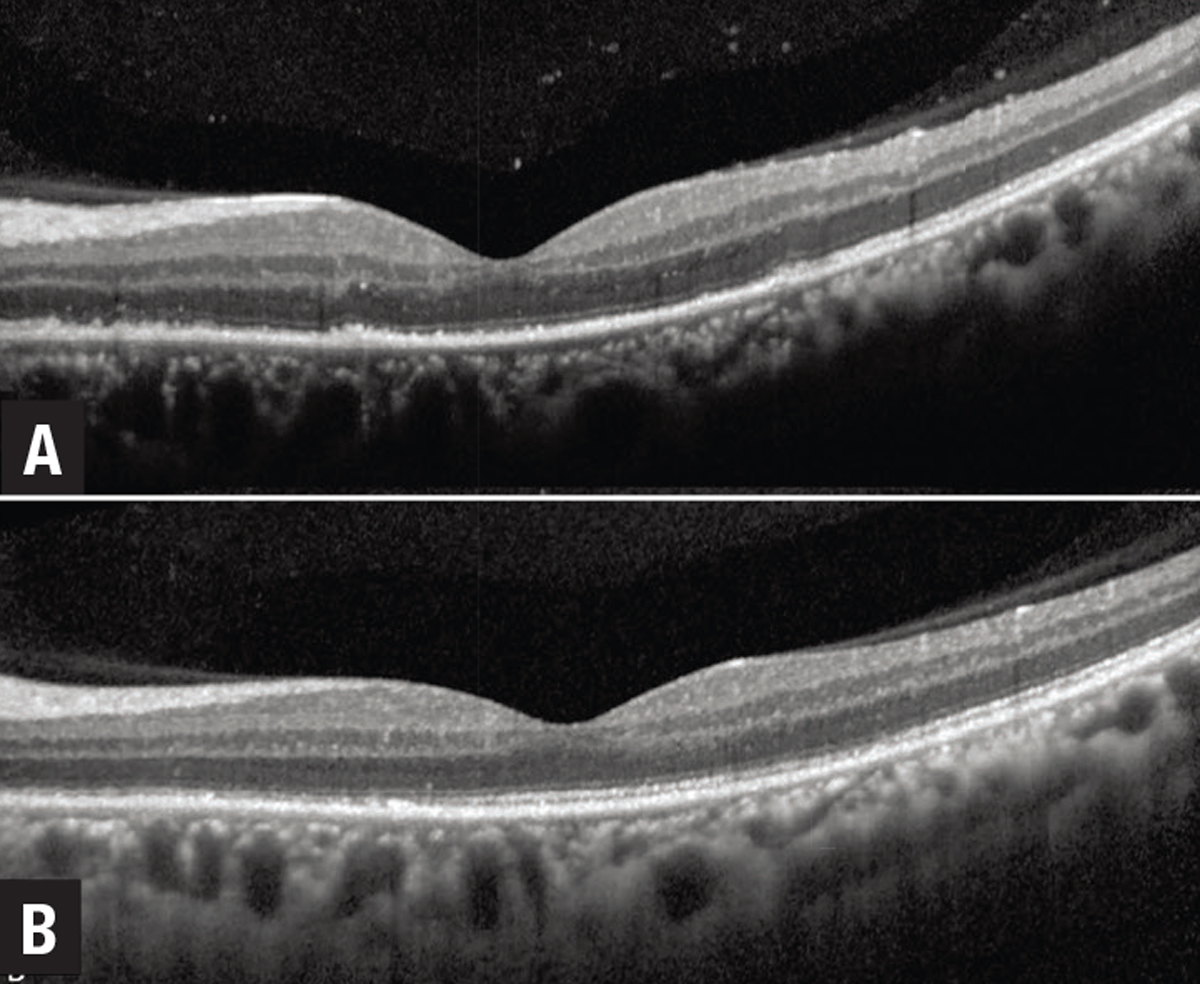
Figure 4. Marked ellipsoid layer loss with preserved external limiting membrane in an eye with syphilitic uveitis with significant reconstitution of the ellipsoid zone following penicillin treatment. |
OCT signs of infectious uveitis include posterior hyaloid face precipitates and vitreous hyperreflective dots, which are often greater in areas overlying the primary chorioretinal focus.14 Retinal lesions in infectious retinitis, such as fungal endophthalmitis, can be seen as hyperreflective, round-shaped lesions in the inner retinal layers extending toward the preretinal space and vitreous.
In placoid syphilis, a characteristic feature is EZ loss with rapid reconstitution after starting penicillin (Figure 4). In toxoplasma chorioretinitis, there’s often marked choroidal thickening under the retinitis area that’s usually not seen in viral retinitis.
Bottom line
Validated quantitative and qualitative biomarkers in uveitis remain an unmet need. OCT plays a critical role in achieving the goal of objective instrument-based quantification to provide a continuous measure of inflammatory activity and determine severity, progression and response to treatment.
We still need to collect more data for validation of these biomarkers, ideally in a prospective, multicenter, standardized manner with planned, prospective OCT imaging using standardized scan patterns. This is critical for further development and validation of OCT biomarkers in uveitis from patient care, research and clinical trial standpoints. RS
REFERENCES
1. Hornbeak DM, Payal A, Pistilli M, et al. Interobserver agreement in clinical grading of vitreous haze using alternative grading scales. Ophthalmology. 2014;121:1643-1648.
2. Denniston AK, Keane PA, Srivastava SK. Biomarkers and surrogate endpoints in uveitis: The impact of quantitative imaging. Invest Ophthalmol Vis Sci. 2017;58:BIO131-BIO140.
3. Pelosini L, Hull CC, Boyce JF, McHugh D, Stanford MR, Marshall J. Optical coherence tomography may be used to predict visual acuity in patients with macular edema. Invest Ophthalmol Vis Sci. 2011;52:2741-2748.
4. Grewal DS, O'Sullivan ML, Kron M, Jaffe GJ. Association of disorganization of retinal inner layers with visual acuity in eyes with uveitic cystoid macular edema. Am J Ophthalmol. 2017;177:116-125.
5. Thomas AS, Hatef AL, Stinnett SS, Keenan RT, Jaffe GJ. Perivascular thickening on optical coherence tomography as a marker of inflammation in birdshot retinochoroiditis. Retina. 2019;39:956-963.
6. Sugar EA, Jabs DA, Altaweel MM, et al. Identifying a clinically meaningful threshold for change in uveitic macular edema evaluated by optical coherence tomography. Am J Ophthalmol. 2011;152:1044-1052.e1045.
7. Finn AP, Thomas AS, Stinnett SS, Keenan RT, Grewal DS, Jaffe GJ. The role of cystoid macular edema as a marker in the progression of non-paraneoplastic autoimmune retinopathy. Graefes Arch Clin Exp Ophthalmol. 2018;256:1867-1873.
8. Ciulla TA, Kapik B, Barakat MR, et al. Optical coherence tomography anatomic and temporal biomarkers in uveitic macular edema. Am J Ophthalmol. 2021;237:310-324.
9. Bolz M, Schmidt-Erfurth U, Deak G, Mylonas G, Kriechbaum K, Scholda C. Optical coherence tomographic hyperreflective foci: A morphologic sign of lipid extravasation in diabetic macular edema. Ophthalmology. 2009;116:914-920.
10. Keane PA, Allie M, Turner SJ, et al. Characterization of birdshot chorioretinopathy using extramacular enhanced depth optical coherence tomography. JAMA Ophthalmol. 2013;131:341-350.
11. Sharma S, Lowder CY, Vasanji A, Baynes K, Kaiser PK, Srivastava SK. Automated analysis of anterior chamber inflammation by spectral-domain optical coherence tomography. Ophthalmology. 2015;122:1464-1470.
12. Agrawal R, Salman M, Tan KA, et al. Choroidal vascularity index (CVI)—A novel optical coherence tomography parameter for monitoring patients with panuveitis? PLoS One. 2016;11:e0146344.
13. Agrawal R, Weng RC, Fonollosa A, et al. Outcome measures for disease monitoring in intraocular inflammatory and infectious diseases (OCTOMERIA): Understanding the choroid in uveitis with optical coherence tomography (OCT). Ocul Immunol Inflamm. Published online February 24, 2022. doi: 10.1080/09273948.2022.2026414
14. Pichi F, Curi ALL, Vasconcelos-Santos DV, et al. Optical coherence tomography findings in infectious posterior uveitis. Ocul Immunol Inflamm. Published online February 28, 2022. doi: 10.1080/09273948.2022.2032197.