Take-home Points
|
 |
|
Bios Dr. Kalra is a research fellow at the Tony and Leona Campane Center for Excellence in Image-Guided Surgery and Advanced Imaging Research at the Cole Eye Institute of the Cleveland Clinic, Cleveland. Dr. Ehlers holds the Norman C. and Donna L. Harbert Endowed Chair for Ophthalmic Research and is director of the Tony and Leona Campane Center for Excellence in Image-Guided Surgery and Advanced Imaging Research at the Cole Eye Institute. DISCLOSURES: Dr. Kalra has no relevant financial relationships to disclose. Dr. Ehlers reported relationships with Zeiss, Adverum, Stealth Therapeutics, Allegro Ophthalmics, Regeneron Pharmaceuticals, Allergan/AbbVie, Roche, Alcon, Oxurion and Novartis. |
With technological advances, retinal imaging has grown tremendously over the past few decades, from providing histology-level detail of the retinal anatomy at the posterior pole with optical coherence tomography to capturing near panretinal disease burden with ultra-widefield imaging. Our diagnostic tools have opened up a whole new world of disease understanding, feature assessment and opportunities for personalized medicine.
 |
A recent addition to our imaging armamentarium is OCT angiography, which had been increasingly adopted in part due to its depth-encoded, non-invasive, rapid-acquisition features. Specialists have traditionally interpreted visual information from these images to identify findings that may confirm diagnosis or assess treatment response.
Beyond diagnosis, qualitative imaging biomarkers have been identified in numerous modalities and retinal disorders that provide important contextual and predictive value for natural history or treatment response. More recently, the advancing field of computational image analysis and machine learning-enhanced image interrogation have opened doors to new biomarkers with quantitative features and potential objective feature parameters. In this review, we explore many of these imaging biomarkers for various modalities and retinal diseases.
Visualizing enhanced anatomy on OCT
The incredible anatomic details that spectral-domain OCT and swept-source OCT provide have revolutionized the field through their impact on diagnosis, disease surveillance and assessment of therapeutic response. Qualitative feature assessment of specific retinal layers and zones has been linked to functional impact and outcomes, including location of retinal fluid and integrity of outer retinal bands. Historically, many of these assessments of retinal integrity were primarily qualitative and often binary. The inability to quantify these features limited the widespread impact of these assessments.
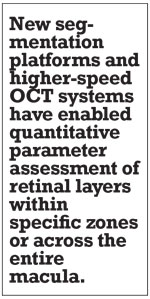
New segmentation platforms and higher-speed OCT systems have enabled quantitative parameter assessment of retinal layers within specific zones or across the entire macula.1-3 En face OCT has provided unique opportunities for depth-specific assessments of features, such as outer retinal loss and network structure of outer retinal tubulation.4
 |
|
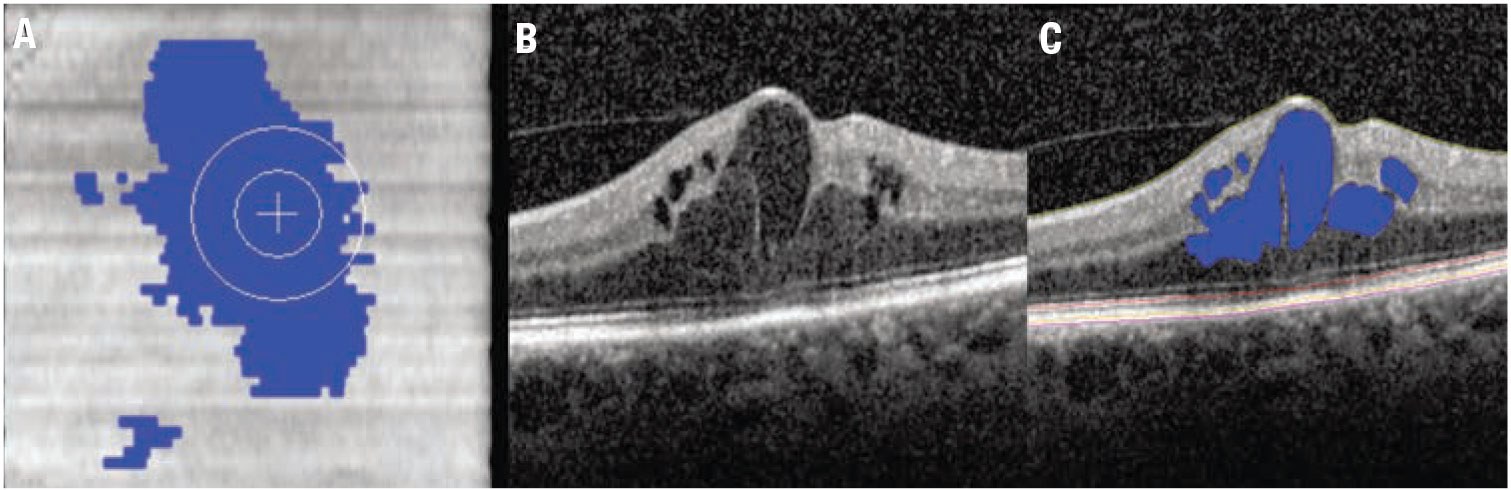
Figure 1. Automated fluid feature detection and optical coherence tomography biomarker detection in diabetic macular edema. A) Fundus OCT image demonstrates en face fluid distribution map. B) Foveal B-scan with significant foveal fluid. C) Foveal B-scan with intraretinal fluid automated segmentation (blue) and multi-layer segmentation lines. |
Multi-layer segmentation platforms, including machine learning-enhanced systems, are now able to provide quantitative outputs for zones and inter-layer thickness/volumes that can be linked to function and other structural dynamics.1-3 Quantitative fluid object characterization now provides next-generation detail of fluid burden and impact on overall disease outcomes and therapeutic response.
Transformative OCT advances
 |
|
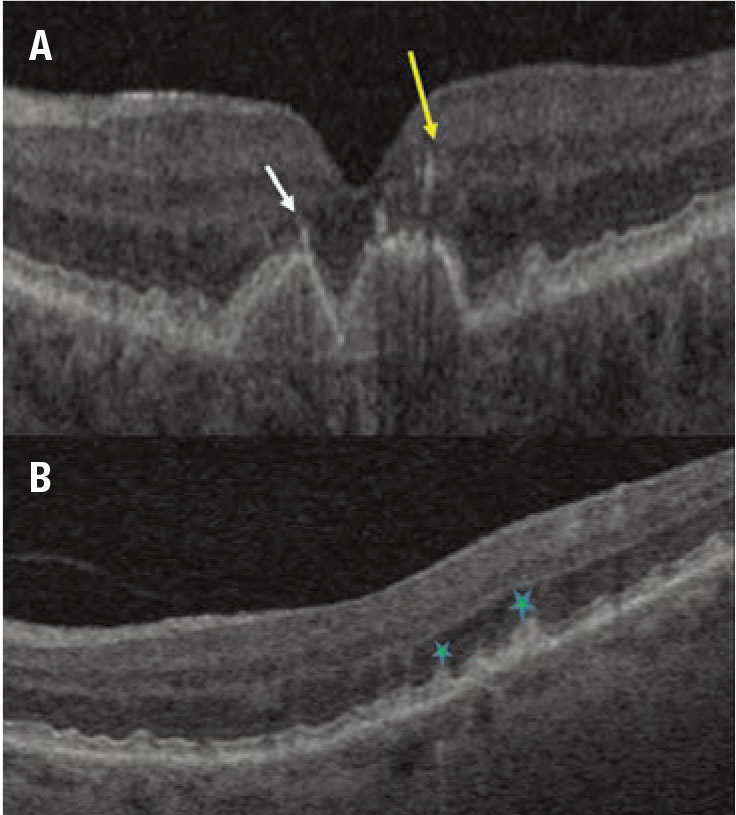
Figure 2. Examples of qualitative optical coherence tomography biomarkers in dry age-related macular degeneration. A) A horizontal spectral-domain OCT B-scan slice through the macula shows confluent hyperreflective foci over the drusenoid pigment epithelial detachment (arrows). B) Horizontal SD-OCT scans demonstrate subretinal drusenoid deposits (stars). |
Our understanding of diabetic eye disease has been transformed through the utilization of structural OCT. The rapid assessment of fluid burden and fluid localization and transitioned therapeutic management could be tailored to the OCT findings rather than the historical “clinically significant” definition of diabetic macular edema. In addition, specific layer alterations, such as disorganized retinal inner layers (DRIL), have been identified as important biomarkers of retinal function and severity of retinal disease.5
Quantitative feature extraction and multilayer assessment have also more recently provided insights into longitudinal retinal layer dynamics. Specifically, recent studies have confirmed improvements in quantitative ellipsoid zone integrity following
anti-VEGF therapy for DME with distinct correlation to functional outcomes.6
Additionally, the ability to volumetrically quantify fluid across the macula and specific zones of interest (e.g., the central subfield) provides a unique opportunity for biomarkers, such as the retinal fluid index (RFI).6,7
The RFI represents the percentage of overall retinal volume from the internal limiting membrane to the retinal pigment epithelium that is composed of retinal fluid (measured as a percentage).6 This biomarker has been demonstrated to be associated with functional outcomes and early instability in RFI during the treatment phase has been linked to long-term volatility to treatment response (Figure 1).6,8
Biomarkers in AMD, GA
Researchers have evaluated nonexudative age-related macular degeneration extensively for various imaging biomarkers. Qualitative features on SD-OCT that have been associated with progression to advanced AMD include intraretinal hyper-reflective foci (IHRF), complex drusenoid lesions (DL, i.e., heterogeneity of reflectivity), subretinal drusenoid deposits (SDD) and drusen burden (Figure 2).9
In fact, these qualitative features have demonstrated the following hazard ratios (HR) for developing late AMD:
- 5.21 for IHRF (95% confidence interval [CI], 3.29-8.26);
- 2.42 for hyporeflective foci (hRF) within DLs (95%CI, 1.74-3.38);
- 1.95 for SDD (95% CI, 1.34-2.82); and
- 1.46 for large drusen volume (95% CI, 1.03-2.07).10
Drusen volume quantification has been enabled through multiple research and commercial analysis platforms. RPE compartment analysis software has been used to evaluate automated drusen volumes in multiple zones of interest and has demonstrated a significant increased risk of the development of geographic atrophy or conversion to neovascular AMD in eyes with larger drusen volumes.11
 |
|
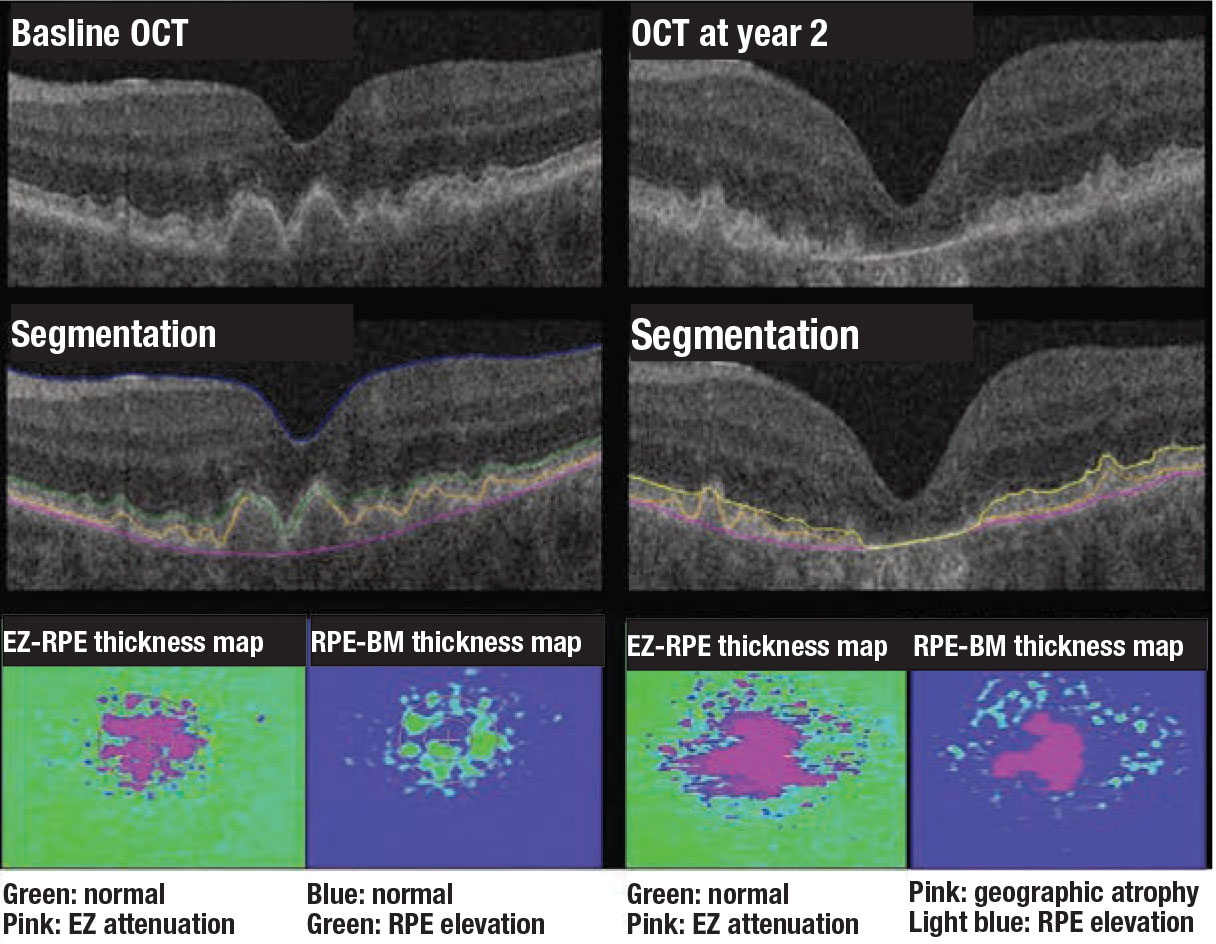
Figure 3. Examples of quantitative optical coherence tomography biomarkers in dry age-related macular degeneration. Two-year progression from intermediate AMD to advanced AMD with subfoveal geographic atrophy. Significant baseline ellipsoid zone attenuation is present that appears to be an important potential biomarker for progression to GA. |
Machine learning enhancements to segmentation and feature extraction are also providing new opportunities for disease characterization and evaluation of longitudinal therapeutic response, including in neovascular AMD. Multiple groups have demonstrated the feasibility of volumetric fluid characterization, compartmental OCT feature evaluation (such as ellipsoid zone integrity) and quantitative volumetric assessment of subretinal fibrosis/subretinal hyperreflective material (Figure 3).12-14
Vascular biomarkers on UWFA, OCTA
Traditionally, angiographic features have been described in a qualitative fashion or relative quantitative assessment, such as by comparing a feature of interest to the number of disc areas that it represents. Although these relative quantitative assessments provide important context, they limit the resolution of comparative evaluation between other key features of interest.
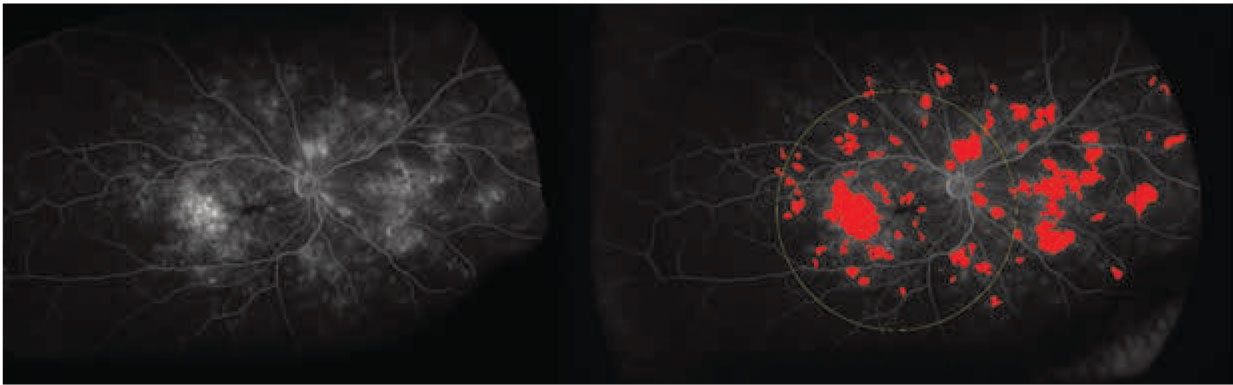
The labor-intensive nature of manual feature assessment had been a barrier to more widespread use. Recently, methods and systems have been developed to provide in-depth evaluation of leakage features, microaneurysm counts, ischemic burden and vascular characteristics (Figure 4).15,16
Machine learning systems have provided the ability to perform enhanced vascular segmentation, feature extraction, and more efficient methods for evaluating imaging characteristics.17-19 The binary depth-encoded nature of OCTA has also provided a new frontier in quantitative feasibility of vascular analysis.
Vascular biomarkers in DR, DME
Automated angiographic quantitative assessment of UWFA features in DR has been shown to be strongly linked to DR severity.20 The quantitative assessment of these disease burden features may be critical in optimizing predictive assessment for risk of progression or DR-related complications. Panretinal leakage index, panretinal ischemic index and total microaneurysm counts are all strongly correlated with DR severity.20
The panretinal leakage index, in particular, has been associated with predicting additional DR-related complications, such as vitreous hemorrhage and DME.21,22 These quantitative parameters also provide a unique opportunity for evaluating a longitudinal treatment response. Using an automated UWFA system, intravitreal anti-VEGF therapy has demonstrated dramatic improvements in leakage index and total microaneurysm counts in DR.21,23 In fact, one recent trial used the panretinal leakage index as the key biomarker for therapeutic decision-making and demonstrated similar efficacy results to DR severity-based treatment decision-making.24 Leakage node distribution and morphology have also been linked to treatment interval tolerance in DME.25
Beyond traditional angiographic features, retinal vasculature analysis has emerged as a promising biomarker for diabetic eye disease generated from UWFA and OCTA. For instance, fractal dimension (FD) represents the complexity of the vascular geometry with higher values indicating dense, intricate, space-filling tree-like patterns. Robust magnification and distortion-related errors are major advantages of FD.26,27 FD in DR has been found to be significantly lower in the far periphery in eyes with DR compared to normals. Additionally, FD for the entire retina showed negative correlation with global non-perfusion area.28
 |
|
Figure 4. Examples of quantitative leakage measurements on fluorescein angiography in diabetic retinopathy: (left) the original ultra-widefield FA scan; and (right) UWFA scan showing automated segmentation of leakage activity. |
One study of swept-source OCTA found the foveal avascular zone to be significantly higher in diabetic eyes than controls.29 In addition, eyes with DR had larger mean perifoveal intercapillary area (PIA) than controls.29 Utilizing quantitative OCTA parameters, novel classification systems for DR have also been proposed using features such as blood vessel tortuosity, vascular caliber, vessel perimeter index, blood vessel density, FAZ area and FAZ contour irregularity.30,31
Bottom line
The exploration, validation and discovery of imaging biomarkers for retinal disease is an exciting and evolving area of research. Thanks to advances in computational power, machine learning systems and diagnostic systems are providing unique opportunities for enhanced understanding of the mechanisms and natural history of disease and the development of a personalized approach to treatment decision-making. Further exploration and validation of these biomarkers and others are needed to provide greater clarity of their optimal role in patient education, clinical trial enrollment optimization and precision medicine. RS
REFERENCES
1. Chiu SJ, Li XT, Nicholas P, Toth CA, Izatt JA, Farsiu S. Automatic segmentation of seven retinal layers in SDOCT images congruent with expert manual segmentation. Opt Express. 2010;18:19413-19428.
2. Schmidt-Erfurth U, Sadeghipour A, Gerendas BS, Waldstein SM, Bogunović H. Artificial intelligence in retina. Prog Retin Eye Res. 2018; 67:1-29.
3. Itoh Y, Vasanji A, Ehlers JP. Volumetric ellipsoid zone mapping for enhanced visualisation of outer retinal integrity with optical coherence tomography. Br J Ophthalmol. 2016; 100:295-299.
4. Dolz-Marco R, Litts KM, Tan AC, Freund KB, Curcio CA. The evolution of outer retinal tubulation, a neurodegeneration and gliosis prominent in macular diseases. Ophthalmology. 2017;124:1353-1367.
5. Sun JK, Lin MM, Lammer J, et al. Disorganization of the retinal inner layers as a predictor of visual acuity in eyes with center-involved diabetic macular edema. JAMA Ophthalmol. 2014;132:1309-1316.
6. Ehlers JP, Uchida A, Hu M, et al. Higher-order assessment of oct in diabetic macular edema from the vista study: Ellipsoid zone dynamics and the retinal fluid index. Ophthalmol Retina. 2019;3: 1056-1066.
7. Roberts PK, Vogl W-D, Gerendas BS, et al. Quantification of fluid resolution and visual acuity gain in patients with diabetic macular edema using deep learning: a post hoc analysis of a randomized clinical trial. JAMA Ophthalmol. 2020;138:945-953.
8. Ehlers JP, Uchida A, Sevgi DD, et al. Retinal fluid volatility associated with interval tolerance and visual outcomes in diabetic macular edema in the VISTA Phase III trial. Am J Ophthalmol. 2021;224: 217-227.
9. Toth CA, Tai V, Chiu SJ, et al. Linking OCT, angiographic, and photographic lesion components in neovascular age-related macular degeneration. Ophthalmol Retina. 2018;2:481-493.
10. Nassisi M, Lei J, Abdelfattah NS, et al. OCT risk factors for development of late age-related macular degeneration in the fellow eyes of patients enrolled in the HARBOR Study. Ophthalmology. 2019;126:1667-1674.
11. Abdelfattah NS, Zhang H, Boyer DS, et al. Drusen volume as a predictor of disease progression in patients with late age-related macular degeneration in the fellow eye. Invest Ophthalmol Vis Sci. 2016;57:1839-1846.
12. Ehlers JP, Zahid R, Kaiser PK, et al. Longitudinal assessment of ellipsoid zone integrity, subretinal hyperreflective material, and subretinal pigment epithelium disease in neovascular age-related macular degeneration. Ophthalmol Retina. Published online February 26, 2021.
13. Ehlers JP, Clark J, Uchida A, et al. Longitudinal higher-order OCT assessment of quantitative fluid dynamics and the total retinal fluid index in neovascular AMD. Trans Vis Sci Tech. 2021;10:29.
14. Waldstein SM, Philip A-M, Leitner R, et al. Correlation of 3-dimensionally quantified intraretinal and subretinal fluid with visual acuity in neovascular age-related macular degeneration. JAMA Ophthalmol. 2016;134:182-190.
15. Rabbani H, Allingham MJ, Mettu PS, Cousins SW, Farsiu S. Fully automatic segmentation of fluorescein leakage in subjects with diabetic macular edema. Invest Ophthalmol Vis Sci. 2015; 56:1482-1492.
16. Ehlers JP, Wang K, Vasanji A, Hu M, Srivastava SK. Automated quantitative characterisation of retinal vascular leakage and microaneurysms in ultra-widefield fluorescein angiography. Br J Ophthalmol. 2017;101:696-699.
17. Sevgi DD, Scott AW, Martin A, et al. Longitudinal assessment of quantitative ultra-widefield ischaemic and vascular parameters in sickle cell retinopathy. Br J Ophthalmol. Published online October 31, 2020.
18. O'Connell M, Sevgi DD, Srivastava SK, et al. Longitudinal precision of vasculature parameter assessment on ultra-widefield fluorescein angiography using a deep-learning model for vascular segmentation in eyes without vascular pathology. Invest Ophthalmol Vis Sci. 2020;61: 2010.
19. Sevgi DD, Hach J, Srivastava SK, et al. Automated quality optimized phase selection in ultra-widefield angiography using retinal vessel segmentation with deep neural networks. Inves Ophthalmol Vis Sci. 2020; 61: PB00125.
20. Ehlers JP, Jiang AC, Boss JD, et al. Quantitative ultra-widefield angiography and diabetic retinopathy severity: an assessment of panretinal leakage index, ischemic index and microaneurysm count. Ophthalmology. 2019; 126:1527-1532.
21. Babiuch AS, Wykoff CC, Srivastava SK, et al. Retinal leakage index dynamics on ultra-widefield fluorescein angiography in eyes treated with intravitreal aflibercept for proliferative diabetic retinopathy in the RECOVERY study. Retina. 2020; 40:2175-2183.
22. Jiang AC, Srivastava SK, Hu M, et al. Quantitative ultra-widefield angiographic features and associations with diabetic macular edema. Ophthalmol Retina. 2020;4:49-56.
23. Figueiredo N, Srivastava SK, Singh RP, et al. Longitudinal panretinal leakage and ischemic indices in retinal vascular disease after aflibercept therapy: The PERMEATE Study. Ophthalmol Retina. 2020;4:154-163.
24. Hannah JY, Ehlers JP, Sevgi DD, et al. Real-time photographic-and fluorescein angiographic-guided management of diabetic retinopathy: Randomized PRIME Trial outcomes. Am J Ophthalmol. 2021;226:126-136.
25. Prasanna P, Bobba V, Figueiredo N, et al. Radiomics-based assessment of ultra-widefield leakage patterns and vessel network architecture in the PERMEATE study: insights into treatment durability. Br J Ophthalmol. Published online August 19, 2020.
26. Mainster MA. The fractal properties of retinal vessels: embryological and clinical implications. Eye. 1990;4:235-241.
27. Li H, Mitchell P, Liew G, et al. Lens opacity and refractive influences on the measurement of retinal vascular fractal dimension. Acta Ophthalmologica. 2010;88:e234-e240.
28. Fan W, Nittala MG, Fleming A, et al. Relationship between retinal fractal dimension and nonperfusion in diabetic retinopathy on ultrawide-field fluorescein angiography. Am J Ophthalmol. 2020;209:99-106.
29. Salz DA, de Carlo TE, Adhi M, et al. Select features of diabetic retinopathy on swept-source optical coherence tomographic angiography compared with fluorescein angiography and normal eyes. JAMA Ophthalmol. 2016;134:644-650.
30. Alam M, Zhang Y, Lim JI, Chan RVP, Yang M, Yao X. Quantitative optical coherence tomography angiography features for objective classification and staging of diabetic retinopathy. Retina. 2020;40.
31. Alam M, Thapa D, Lim JI, Cao D, Yao X. Quantitative characteristics of sickle cell retinopathy in optical coherence tomography angiography. Biomed Opt Express 2017; 8: 1741-53.