 |
In retinal degeneration, functional findings from visual field (VF) measures can often be used to complement visual-acuity testing for diagnosis and assessment of its progression.
For example, subjects with neovascular or non-neovascular advanced age-related macular degeneration can still have excellent visual acuity but complain of metamorphopsia and decreased quality of vision in the central 10 to 20 degrees. So why not use Humphrey visual fields to evaluate patients with retinal diseases?
Unfortunately, traditional VF testing is not useful in most patients with retinal disease because central fixation is often impacted and VF tests are too unreliable. In fact, even microsaccades and drifts in relatively normal subjects significantly impact the reliability of traditional visual fields, and the learning curve for reliable performance on VF is well demonstrated.2 In addition, there is a need to correlate visual function with the clinical appearance of retinal pathology that is not possible with traditional VF, but is essential in retinal disease assessment.
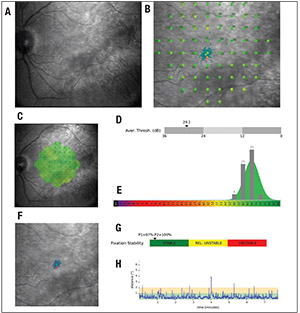 |
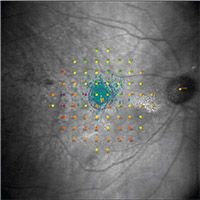
| Figure 1. Example of microperimetry results in a healthy subject: A) scanning-laser ophthalmoscope (SLO) image of the fundus; B) retinal sensitivity measures superimposed on the SLO fundus image; C) retinal-sensitivity measures interpolated in a retinal-sensitivity map; D) average sensitivity threshold (dB; arrow indicates average sensitivity measure); E) distribution of sensitivity thresholds shown in bars, superimposed on a normative database (hotter colors indicate further deviations from the normative database); F) fixation points (blue dots) superimposed on SLO fundus image (fixation stability is computed using the bivariate contour ellipse area analysis); G) classification of fixation stability; and H) fixation stability plotted at individual time points. |
MP addresses both major limitations of traditional VF assessments as they pertain to retinal diseases. Namely, MP uses real-time tracking of the retinal movements during testing to provide spatially registered measurements of retinal sensitivity on a fundus image of the retina by (Figure 1). This minimizes the impact of poor fixation and also provides a fundus image registered to the retinal sensitivity measurements for the clinician to review.
Retinal tracking is commonly performed with a scanning laser ophthalmoscope (SLO) that detects movement of the retina in real time and allows the device to correct the position of the light stimulus for any changes in fixation. This helps to reduce errors that eye movements cause on the retinal locations the test stimulates, and allows for an improved test-retest of the same retinal location.3 This correction is particularly useful in assessing residual visual function for patients who have severe vision loss and/or eccentric fixation.3 One additional benefit of this tracking feature is that MP devices can provide information on fixation patterns and preferred retinal loci.
Available Devices
Currently, three commercially available microperimeters are available: the Nidek MP-3 (Nidek Technologies); the Optos OCT/SLO (Optos) and the MAIA microperimeter (MAIA). Except for the added optical coherence tomography component of the Optos OCT/SLO, these devices have similar functions but differ in their dynamic range. For example, the dynamic range of the MP-3, Optos OCT/SLO andMAIAare0to34dB,0to 20dB and 0 to 36 dB, respectively.3-5
In addition, the background luminance, maximum stimulus luminance and stimuli projection system of the devices differ. In a recent report comparing the findings from Nidek MP-3 and MAIA in healthy subjects, retinal sensitivity measures were higher with MAIA than with the MP-3.6 These relationships were consistent between the devices and application of a 5.65dB correction factor was able to interrelate the measurement from the two instruments.6
 |
Utility of Fixation Testing
In addition to retinal sensitivity, MP devices also document the stability of fixation by measuring the subject’s fixation location up to 25 times per second. Fixation testing refers to measuring the precision of the eye fixating on a target for a certain period of time, and has been demonstrated to be relatively stable in normal subjects regardless of age.7,8
 |
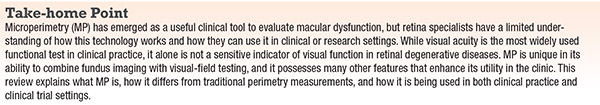
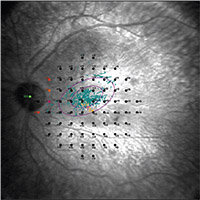
| Figure 2. Preferred retinal locus (PRL) and fixation stability in a subject with non-neovascular age-related macular degeneration and geographic atrophy. The two purple ellipses show the bivariate contour ellipse areas encompassing 63 percent and 95 percent of the fixation points, respectively. The center of the ellipse shows the PRL. Fixation stability in this subject was graded as unstable. |
Fixation stability can be reported using one of two general approaches. For example, a simple clinical classification proposed by Gildo Fujii, MD, and colleagues11 calculated the percentage of fixation points falling within a circle of 2 or 4 degrees in diameter and classifies fixation into one of three categories:
• stable—more than 75 percent of fixation points fall within a 2-degree circle;
• relatively unstable—fewer than 75 percent of fixation points fal l within a 2-degree circle but more than 75 percent of fixation points fall within a 4-degree circle; and
• unstable—fewer than 75 percent of fixation points fall within a 4-degree circle.11
The percentage-based fixation stability measure is advantageous because of its clinical thresholds, but the 75 percent threshold has been criticized as too low. A recent study revealed that eyes with intermediate AMD were considered “stable” because of the low threshold.15 Furthermore, healthy individuals typically have more than 97 percent of their fixation points within the 4-degree circle.11,15
 |
| Figure 3. Retinal sensitivity findings in a patient with nonproliferative diabetic retinopathy. Retinal sensitivity is generally decreased over areas with hard exudates. Green indicates a region with greatest sensitivity (normal sensitivity) and red indicates a region with lowest sensitivity. |
In contrast, another method uses bivariate contour ellipse area (BCEA), as Michael Crossland, PhD, and colleagues have suggested.10 The BCEA method calculates the area and orientation of an ellipse encompassing a given proportion of the fixation points’ dataset, where lower BCEA values indicate better fixation stability. Different authors have used three different statistical thresholds—63 percent,8,12 68 percent13 or 95 percent14—to calculate BCEA, but no clear evidence suggests which is the best.
BCEA is useful because it is a mathematical model capable of describing irregularly shaped
sets of points, but it does not have widely accepted cutoffs to distinguish between stable and unstable fixation. Also, it’s not clear that the distribution of fixation points is normally distributed, which is the assumption of the BCEA model.
Individuals with macular disease compensate for the loss of central vision by using healthy parts of the retina called preferred retinal loci (PRL).7 PRLs can develop on any part of the retina. They can be single or multiple, and can offer superior vision compared to other retinal areas.7,15
Microperimeters offer the ability to accurately determine the precise location of a PRL, indicated as a circumscribed area with a majority of fixation points as determined by one of the methods described previously or by qualitative inspection (Figures 1 and 2).15 The distance from the estimated anatomical fovea, the pattern, the orientation and number of PRL can be calculated and also be used as a measure of visual function.15
The unique ability of MP devices to measure fixation and retinal sensitivity in a spatially registered manner with fundus images has enabled MP to become an increasingly useful method of detecting subclinical changes in early states of disease as well as very advanced disease.
 |
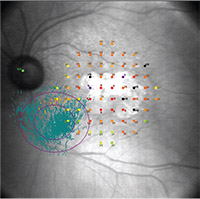
| Figure 4. Microperimetry findings in a patient with ABCA4-related Stargardt’s disease shows impaired retinal sensitivity and the location of a preferred retinal locus. Fixation stability of the preferred retinal locus, calculated using the bivariate contour ellipse area analysis, was graded as unstable in this patient. |
MP has a high test-retest reliability in patients with early and intermediate stages of macular disease.16 In one study, 200 healthy controls demonstrated the highest mean retinal sensitivity, whereas among the 200 individuals with AMD the mean sensitivity for those with early AMD was higher than for those with intermediate AMD.17 In a study identifying visual-function metrics to evaluate stages of AMD, standard and computerized low-luminance visual acuity, MP, cone contrast testing and dark adaptation all distinguished early from intermediate AMD.18 Of these measures, however, the thresholds for MP average and percentreduced were found to be the most sensitive measures to distinguish between all groups.18 Thus, MP is a more sensitive indicator of disease severity compared to other functional measures.
Individuals with advanced macular degeneration have impaired retinal sensitivity and fixation stability, contributing to poor visual performance (Figure 2). Fixation stability was shown to deteriorate from stable to unstable in eyes with intermediate AMD over a six-year period.19
Positive correlations were found between fixation stability, visual acuity, PRL distance from the former fovea, and time since diagnosis, suggesting that the PRL becomes wider and farther from the former fovea as time progresses.7 By tracking fixation stability and location of PRLs, MP can provide a comprehensive assessment of macular function and monitor natural disease progression.
MP has also been used to examine the relationship between visual function and retinal morphology using spectral-domain OCT. Patients with early AMD have shown significant thinning of the outer segment (OS) layer, and thickening and elevation of the retinal pigment epithelium in areas with VF defects compared to locations without defects.20 RPE-plus-OS volume was also positively correlated with retinal sensitivity, indicating that a thicker outer retina was associated with better sensitivity.21
In eyes with geographic atrophy, the average retinal sensitivity of areas with photoreceptor damage outside the area of RPE loss was lower than that of the area without such photoreceptor damage; and this area of damage was larger in eyes with pseudodrusen.22 Retinal sensitivity appears to drop precipitously at the margins of GA lesions compared to eyes with less advanced non-neovascular AMD.23 Partial outer retinal thickness, defined as the distance between the outer plexiform layer and the ellipsoid zone, and retinal sensitivity were decreased over areas with retinal drusen compared to unaffected retinal areas.24 By correlating areas of visual defects to structural abnormalities, MP allows for topographic evaluation of macular disease to reveal associations that were otherwise not known.
Changes in retinal sensitivity and fixation stability measured by MP have also been used as outcome measures in medical or surgical interventions for AMD. In individuals with wet AMD undergoing anti-VEGF therapy with bevacizumab (Avastin, Roche/Genentech), mean sensitivity increased as retinal thickness decreased, and decreased as retinal thickness increased after six months of intravitreal injections.25 In a clinical trial assessing the safety and efficacy of a human embryonic stem-cell-derived RPE implant in five subjects with advanced non-neovascular AMD, two eyes improved from unstable to stable fixation after implantation.27
MP in Diabetic Retinopathy
MP has been used to investigate the occurrence of neuronal damage before clinical evidence of diabetic retinopathy.28 Studies have shown that retinal sensitivity decreases in eyes with DR, and this was significantly lower over areas with hard exudates (Figure 3).29
Glucose control also affects retinal sensitivity, with HbA1c values accounting for a 54.5-percent reduction in retinal sensitivity.30 In a study comparing diabetic subjects with and without retinopathy, statistically significant differences were reported in foveal thickness, photoreceptor layer thickness, and mean RS.31
In a large population-based study of 357 subjects with diabetes, a reduction in mean retinal sensitivity was significantly correlated to central foveal thickness in subjects with no DR, suggesting early neuronal degeneration in diabetic retinopathy.32 Another study further explored this structure-function relationship, showing a significant correlation between retinal sensitivity and ganglion cell layer-inner plexiform layer (GCL-IPL) thickness in subjects with diabetes, but not in healthy controls.33 No significant differences in best-corrected visual acuity were found between the two groups, indicating that neuronal damage may be present in individuals who may otherwise appear normal by conventional visual-acuity measures.33
Retinal sensitivity measured by MP has also been used as an important functional metric in the evaluation of diabetic macular edema. A significant inverse relationship was found between retinal sensitivity and normalized macular thickness in patients with clinically significant macular edema, with a decay of 0.83 dB for every 10-percent deviation of retinal thickness from normal values.34 However, another study found no significant correlation between retinal sensitivity and retinal thickness in focal DME, but did find a significant reduction in retinal sensitivity and increase in retinal thickness for eyes with edema secondary to branch retinal vein occlusion.
Greater retinal sensitivity also correlated with faster maximum reading speed (MRS) and better BCVA in DME patients.35 While MRS is not a practical measure of retinal function because it can be inconsistent and is affected by language barriers and educational level, MP testing is a fast and effective marker of retinal function.
Fixation characteristics have also been described in the evaluation of diabetes. Visual acuity is significantly reduced in diabetic patients with relatively unstable and poor central fixation.36 In a study of patients with DME, fixation location and stability were not significantly influenced by edema characteristics, except for the presence of subfoveal hard exudates.37 Patients with
DME who underwent monthly intravitreal ranibizumab injections (Lucentis, Roche/Genentech) demonstrated a significant reduction of central retinal thickness, increased BCVA, and improved fixation stability over a three-month period.38
MP in Stargardt’s
In patients with ABCA4-associated Stargardt’s disease (STGD), MP has been used as an outcome measure for monitoring disease progression (Figure 4). Macular sensitivity has been used to quantify the decline of visual function in longitudinal studies of patients with STGD.39
In a prospective study analyzing light sensitivity of the macula in 326 eyes with ABCA4 STGD1, mean sensitivity was worse in the inner rings closest to the fovea and best in the outer ring. This trend was reflected by the distribution of deeply scotomatous points, the percentage of which was highest in the fovea and smallest in the outer ring.40
When MP was used to examine the visual function of flecked areas, a significant difference in mean retinal sensitivity was found between flecked areas and unflecked areas, with most flecked areas having a decrease in sensitivity.41 SD-OCT in the flecked areas also revealed hyper-reflective dome-shaped lesions in the RPE, with disruption of the photoreceptor layer.41
As a result of macular atrophy, patients with Stargardt’s disease develop eccentric and unstable fixation, leading to difficulties reading despite fairly good visual acuity.42 They also adopt PRLs in a spared area of the retina. MP is a useful tool for identifying these PRLs and examining fixation stability together with other functional measures such as sensitivity (Figure 4).
In a multimodal analysis of the PRL in Stargardt’s disease, eccentric PRLs located at the edge of central macular atrophy were associated with intact ellipsoid zone (EZ) band, and normal fundus autofluorescence (AF).43 PRLs located further from the border of macular atrophy had a transition zone, which was associated with decreased sensitivity, absence or disruption of the EZ band, and abnormal FAF patterns.43
Thus, the relative position of the PRL to the edge of the macular atrophy in Stargardt’s can be a predictor of the structural integrity of the region between the edge of the macular atrophy and the PRL.
A recent study demonstrated that biofeedback techniques can be inculcated into microperimetric testings for rehabilitation in patients with STGD.44 The study showed significant improvements in fixation stability, mean BCVA, mean reading speed and contrast sensitivity for subjects with biofeedback training sessions.44 This demonstrates the potential role of MP for therapeutic training in managing retinal degeneration in Stargardt’s disease.
Conclusion
Visual acuity on its own is not a sensitive indicator of visual function in retinal degenerative diseases. Growing evidence supports the use of MP as a clinical and research tool. Its ability to compensate for eye movements, identify preferred retinal loci, and assess fixation stability enhances its utility in diagnosing and monitoring disease progression.
Microperimetric measurements of retinal sensitivity and fixation stability can detect early stages of disease and evaluate clinical outcomes for therapeutic interventions. Hence, MP is well suited for patients with extrafoveal or unstable fixation, and should be considered an important component of functional testing in assessing retinal degenerative conditions.
References
1. Hawkins AS, Szlyk JP, Ardickas Z, Alexander KR, Wilensky JT. Comparison of contrast sensitivity, visual acuity, and Humphrey visual field testing in patients with glaucoma. J Glaucoma. 2003;12:134-138.
2. Johnson CA, Keltner JL, Cello KE, et al. Baseline visual field characteristics in the ocular hypertension treatment study. Ophthalmology. 2002;109:432-437.
3. Cassels NK, Wild JM, Margrain TH, Chong V, Acton JH. The use of microperimetry in assessing visual function in age-related macular degeneration. Surv Ophthalmol. 2018;63:40-55.
4. Acton JH, Greenstein VC. Fundus-driven perimetry (microperimetry) compared to conventional static automated perimetry: Similarities, differences, and clinical applications. Can J Ophthalmol. 2013;48:358-363.
5. Hanout M, Horan N, Do DV. Introduction to microperimetry and
its use in analysis of geographic atrophy in age-related macular degeneration. Curr Opinion Ophthalmol. 2015;26:149-156.
6. Balasubramanian S, Uji A, Lei J, Velaga S, Nittala M, Sadda S. Interdevice comparison of retinal sensitivity assessments in a healthy population: the CenterVue MAIA and the Nidek MP-3 microperimeters. Br J Ophhalmol. 2018;102:109-113.
7. Tarita-Nistor L, González EG, Markowitz SN, Steinbach MJ. Fixation characteristics of patients with macular degeneration recorded with the mp-1 microperimeter. Retina. 2008;28:125133.
8. Kosnik W, Fikre J, Sekuler R. Visual fixation stability in older adults. Invest Ophthalmol Vis Sci. 1986;27:1720-1725.
9. Schönbach EM, Ibrahim MA, Kong X, et al. Metrics and acquisition modes for fixation stability as a visual function biomarker. Invest Ophthalmol Vis Sci. 2017;58:BIO268-BIO276. 10. Crossland MD, Dunbar HM, Rubin GS. Fixation stability measurement using the MP1 microperimeter. Retina. 2009;29:651-656.
11. Fujii GY, de Juan E, Sunness J, Humayun MS, Pieramici DJ, Chang TS. Patient selection for macular translocation surgery using the scanning laser ophthalmoscope. Ophthalmology. 2002;109:1737-1744.
12. Steinman RM. Effect of target size, luminance, and color on moncular fixation. J Optical Soc Am. 1965;55:1158-1165. 13. Crossland MD, Sims M, Galbraith RF, Rubin GS. Evaluation of a new quantitative technique to assess the number and extent of preferred retinal loci in macular disease. Vision Res. 2004;44:1537-1546.
14. Morales MU, Saker S, Wilde C, et al. Reference clinical database for fixation stability metrics in normal subjects measured with the MAIA microperimeter. Transl Vis Sci Technol. 2016;5:6.
15. Markowitz SN, Reyes SV. Microperimetry and clinical practice: an evidence-based review. Can J Ophthalmol. 2013;48:350-357.
16. Chandramohan A, Stinnett SS, Petrowski JT, et al. Visual function measures in early and intermediate age-related macular degeneration. Retina. 2016;36:1021-1031.
17. Vujosevic S, Smolek MK, Lebow KA, Notaroberto N, Pallikaris A, Casciano M. Detection of macular function changes in early (AREDS 2) and intermediate (AREDS 3) age-related macular degeneration. Ophthalmologica. 2011;225:155-160.
18. Cocce KJ, Stinnett SS, Luhmann UFO, et al. Visual function metrics in early and intermediate dry age-related macular degeneration for use as clinical trial endpoints. Am J Ophthalmol. 2018;189:127-138.
19. Vujosevic S, Pucci P, Casciano M, et al. Long-term longitudinal modifications in mesopic microperimetry in early and intermediate age-related macular degeneration. Graefes Arch Clin Exp Ophthalmol. 2017;255:301-309.
20. Acton JH, Smith RT, Hood DC, Greenstein VC. Relationship between retinal layer thickness and the visual field in early age-related macular degeneration. Invest Ophthalmol Vis Sci. 2012;53:7618-7624.
21. Tepelus TC, Hariri AH, Al-Sheikh M, Sadda SR. Correlation between mesopic retinal sensitivity and optical coherence tomographic metrics of the outer retina in patients with nonatrophic dry age-related macular degeneration. Ophthalmic Surg Lasers Imaging Retina. 2017;48:312-318.
22. Takahashi A, Ooto S, Yamashiro K, et al. Photoreceptor damage and reduction of retinal sensitivity surrounding geographic atrophy in age-related macular degeneration. Am J Ophthalmol. 2016;168:260-268.
23. Hariri AH, Tepelus TC, Akil H, Nittala MG, Sadda SR. Retinal sensitivity at the junctional zone of eyes with geographic atrophy due to age-related macular degeneration. Am J Ophthalmol. 2016;168:122-128.
24. Steinberg JS, Saßmannshausen M, Fleckenstein M, et al. Correlation of partial outer retinal thickness with scotopic and mesopic fundus-controlled perimetry in patients with reticular drusen. Am J Ophthalmol. 2016;168:52-61.
25. Hartmann KI, Oster SF, Amini P, Bartsch DU, Cheng L, Freeman WR. SLO-microperimetry in wet age-related macular degeneration during anti-VEGF therapy. Ophthalmic Surg Lasers
Imaging Retina. 2015;46:824-830.
26. Vessey KA, Ho T, Jobling AI, et al. Nanosecond laser treatment for age-related macular degeneration does not induce focal vision loss or new vessel growth in the retina. Invest Ophthalmol Vis Sci. 2018;59:731-745.
27. Kashani AH, Lebkowski JS, Rahhal FM, et al. A bioengineered retinal pigment epithelial monolayer for advanced, dry agerelated macular degeneration. Sci Transl Med. 2018;10: eaao4097.
28. Verma A, Raman R, Vaitheeswaran K, et al. Does neuronal damage precede vascular damage in subjects with type 2 diabetes mellitus and having no clinical diabetic retinopathy? Ophthalmic Res. 2012;47:202-207.
29. Raman R, Nittala MG, Gella L, Pal SS, Sharma T. Retinal sensitivity over hard exudates in diabetic retinopathy. J Ophthalmic Vis Res. 2015;10:160-164.
30. Sharanjeet-Kaur, Ismail SA, Mutalib HA, Ngah NF. HbA1c and retinal sensitivity in diabetics using microperimetry. J Optom. 2018 May 26 [Epub ahead of print].
31. Verma A, Rani PK, Raman R, et al. Is neuronal dysfunction an early sign of diabetic retinopathy? Microperimetry and spectral domain optical coherence tomography (SD-OCT) study in individuals with diabetes, but no diabetic retinopathy. Eye (Lond). 2009;23:1824-1830.
32. Gella L, Raman R, Kulothungan V, Saumya Pal S, Ganesan S, Sharma T. Retinal sensitivity in subjects with type 2 diabetes mellitus: Sankara Nethralaya Diabetic Retinopathy Epidemiology and Molecular Genetics Study (SN-DREAMS II, Report No. 4). Br J Ophthalmol. 2016;100:808-813.
33. Montesano G, Gervasoni A, Ferri P, et al. Structurefunction relationship in early diabetic retinopathy: A spatial correlation analysis with OCT and microperimetry. Eye (Lond). 2017;31:931-939.
34. Vujosevic S, Midena E, Pilotto E, Radin PP, Chiesa L, Cavarzeran F. Diabetic macular edema: Correlation between microperimetry and optical coherence tomography findings. Invest Ophthalmol Vis Sci. 2006;47:3044-3051.
35. Edington M, Sachdev A, Morjaria R, Chong V. Structuralfunctional correlation in patients with diabetic macular edema. Retina. 2017;37:881-885.
36. Gella L, Raman R, Pal SS, Ganesan S, Sharma T. Fixation characteristics among subjects with diabetes: SN-DREAMS II, Report No. 5. Can J Ophthalmol. 2015;50:302-309.
37. Vujosevic S, Pilotto E, Bottega E, Benetti E, Cavarzeran F, Midena E. Retinal fixation impairment in diabetic macular edema. Retina. 2008;28:1443-1450.
38. Seidensticker F, Reznicek L, Cserhati S, et al. [Improvement of fixation in diabetic macular oedema patients under intravitreal ranibizumab treatment]. Klin Monbl Augenheilkd. 2013;230:524-529.
39. Testa F, Melillo P, Di Iorio V, et al. Macular function and morphologic features in juvenile Stargardt disease: Longitudinal study. Ophthalmology. 2014;121:2399-2405.
40. Schönbach EM, Wolfson Y, Strauss RW, et al. Macular sensitivity measured with microperimetry in Stargardt disease in the Progression of Atrophy Secondary to Stargardt Disease (ProgStar) Study: Report no. 7. JAMA Ophthalmol. 2017;135:696-703.
41. Verdina T, Tsang SH, Greenstein VC, et al. Functional analysis of retinal flecks in Stargardt disease. J Clin Exp Ophthalmol. 2012 Jul 30;3. doi: 10.4172/2155-9570.1000233.
42. Rohrschneider K, Glück R, Blankenagel A, Völcker HE. [Fixation behavior in Stargardt disease. Fundus-controlled studies]. Ophthalmologe. 1997;94:624-628.
43. Verdina T, Greenstein VC, Sodi A, et al. Multimodal analysis of the preferred retinal location and the transition aone in patients with Stargardt disease. Graefes Arch Clin Exp Ophthalmol. 2017;255:1307-1317.
44. Verdina T, Giacomelli G, Sodi A, et al. Biofeedback rehabilitation of eccentric fixation in patients with Stargardt disease. Eur J Ophthalmol. 2013;23:723-731.