These changes include increased reflectivity from the outer retina to Bruch’s membrane and the accumulation of fluid in and under the retina, and under the retinal pigment epithelium (RPE).
To directly visualize the macular neovascularization (MNV), we needed to perform invasive dye-based angiographic techniques such as fluorescein angiography and indocyanine angiography. Now, with the development of OCT angiography (OCTA), it is possible to directly image the MNV in the retina (type 3), under the retina and above the RPE (type 2), and under the RPE (type 1).
What is OCTA?
OCTA detects blood flow by performing multiple B-scans at the same position, and the algorithms generate a decorrelation signal based on changes in the intensity and/or phase information between repeated OCT B-scans. This decorrelation signal, which reflects subtle differences between B-scans at the same position, results mostly from the movement of erythrocytes within blood vessels.
While different OCTA instruments use different hardware configurations and different decorrelation algorithms, the basic premise for the detection of blood flow remains the same for all the different OCTA imaging strategies.
Nowadays, two main types of OCTA instruments are used to detect MNV: spectral-domain OCTA (SD-OCTA) and swept-source OCTA (SS-OCTA). Both use Fourier domain detection techniques, but the SD-OCT instruments use a broadband near-infrared super luminescent diode as a light source, currently with a center wavelength of approximately 840 nm, with a spectrometer as the detector,
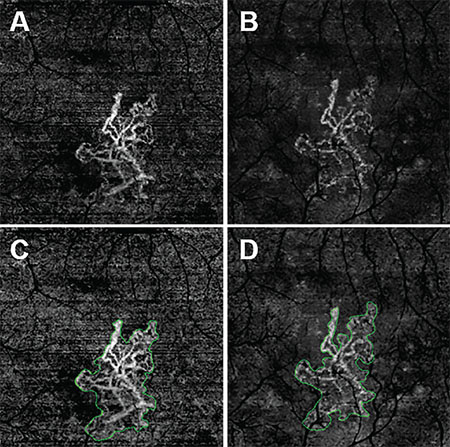 |
| Figure 1. En face swept-source (SS) and spectral-domain (SD) optical coherence tomography angiography (OCTA) images of the left eye from an 81-year-old man with macular neovascularization (MNV) secondary to age-related macular degeneration. All images were processed from the corresponding volumetric datasets using the same algorithms applied to a slab from the outer retina to the choriocapillaris with removal of the projection artifacts from the retinal vasculature. SS-OCTA 3-mm × 3-mm scan (A); SD-OCTA 3-mm × 3-mm scan (B); SS-OCTA 3-mm × 3-mm scan with an outline of the MNV and an area of 1.029 mm2 (C); and SD-OCTA 3-mm × 3-mm scan with an outline of the choroidal neovascularization and an area of 0.958 mm2 (D). |
Which Is Better For Detecting MNV?
The main advantage of SS-OCTA imaging over SD-OCTA is a faster scanning speed, which allows for denser scan patterns and larger scan areas than SD-OCTA scans for a given acquisition time.
Another advantage of the current SS-OCTA technology is that it uses a longer center wavelength that can reduce sensitivity roll-off of the signal under the RPE, which results in enhanced light penetration into the choroid and better detection of signals from the deeper layers.
Additionally, the longer wavelength of SS-OCTA is safer for the eye and allows for the use of a higher laser power.
All of this improves the likelihood that SS-OCTA will detect the inherently weaker signals from deeper layers of the retina. Overall, these advantages should help the SS-OCT system overcome the barrier of the RPE, resulting in better detection of type 1 MNV compared with SD-OCTA imaging.
SD-OCTA vs. SS-OCTA In Detecting CNV
While reports have shown that SD-OCTA imaging detects some MNV in neovascular AMD, the ability of SD-OCTA to detect neovascularization under the RPE appears to have its limitations. This has been reported in cases when choroidal neovascularization (CNV) is known to be present from dye-based angiographic imaging and OCT structural alterations, but SD-OCTA did not detect the neovascular lesion.
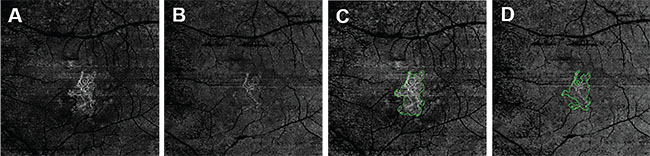 |
| Figure 2. These en face swept-source (SS) and spectral-domain (SD) optical coherence tomography angiography (OCTA) images are of the same eye of the same patient in Figure 1. They were processed from the corresponding volumetric datasets using the same algorithms that were applied to a slab from the outer retina to the choriocapillaris with removal of the projection artifacts from the retinal vasculature. They are: SS-OCTA 6-mm × 6-mm scan (A); SD-OCTA 6-mm × 6-mm scan (B); SS-OCTA 6-mm × 6-mm scan with an outline of the choroidal neovascularization (CNV) and an area of 1.208 mm2 (C); and SD-OCTA 6-mm × 6-mm scan with an outline of the CNV and an area of 0.841 mm2 (D). |
A recent report compared the ability of SD-OCTA and SS-OCTA to detect CNV and concluded that SS-OCTA imaging appeared to be better than SD-OCTA in demarcating the full extent of the type 1 MNV.3
Another group performed a similar comparison study and reported that SS-OCTA showed more CNV lesions with a higher sensitivity for detecting CNV than SD-OCTA.4 However, this study had a serious limitation: It used different segmentation strategies to visualize the full extent of the neovascular lesions in the two imaging techniques.
We recently performed a study using a commercially available SD-OCTA instrument and a prototype SS-OCTA instrument (Carl Zeiss Meditec, Dublin, Calif.).5 We analyzed output data from both instruments using the same segmentation slabs, the same complex decorrelation algorithm, known as optical microangiograhy (OMAG), and the same retinal vascular projection artifact removal algorithm. We showed that SS-OCTA tended to capture a larger area of the neovascular lesions than SD-OCTA in both 3-mm x 3-mm scans and 6-mm x 6-mm scans.
The difference in lesion areas was much larger for the 6-mm x 6-mm scans than the 3-mm x 3-mm scans, which may be due to lower contrast- to-noise ratio (CNR) values in the SD-OCTA 6-mm x 6-mm scans. Later this finding was confirmed by using an automated quantification algorithm to measure the area of MNV.6
These results have great importance for the clinician when longitudinally following MNV because the lesions routinely grow larger than the 3-mm x 3-mm scan area, and larger scan areas are needed to visualize the full extent of the MNV.
Comparing Scans With The Same Algorithms
An 81-year-old male followed for neovascular AMD was imaged on both SS-OCTA and SD-OCTA. All images were processed from the corresponding volumetric datasets using the same algorithms that were applied to a slab that extended from the outer retina to the choriocapillaris and included the removal of the projection artifacts from the retinal vasculature.
The images from SS-OCTA (Figures 1A, C) and SD-OCTA (Figures 1B, D) had the similar size of MNV on 3-mm x 3-mm scans, but the SS-OCTA image showed more details and contrast of the MNV, especially on the lesion border. SS-OCTA images showed larger lesion areas in 6-mm x 6-mm scans and more of the vascular details (Figure 2).
When imaged with SS-OCTA, the areas of the MNV tended to be larger than with SD-OCTA, and the differences in the area measurements occurred at the margins of the MNV where recurrences tend to arise.
 |
For real-world imaging of MNV, the clinician will become dependent on OCTA images, not only for the detection of these lesions, but, more importantly, for their follow-up. We predict that we will need scan areas of at least 6-mm x 6-mm to detect MNV growth when deciding whether to treat, observe or extend a treatment interval. RS
Disclosure: Dr. Rosenfeld received research support from Carl Zeiss Meditec.
REFERENCES
1. Rosenfeld PJ. Optical coherence tomography and the development of antiangiogenic therapies in neovascular age-related macular degeneration. Invest Ophthalmol Vis Sci. 2016;57:14-26.
2. Potsaid B, Baumann B, Huang D, et al. Ultrahigh speed 1050nm swept source/Fourier domain OCT retinal and anterior segment imaging at 100,000 to 400,000 axial scans per second. Opt Express. 2010;18: 20029-20048.
3. Novais EA, Adhi M, Moult EM. Choroidal neovascularization analyzed on ultrahigh-speed swept-source optical coherence tomography angiography compared to spectral-domain optical coherence tomography angiography. Am J Ophthalmol. 2016;164:80-88.
4. Told R, Ginner L, Hecht A, et al. Comparative study between a spectral domain and a high-speed single-beam swept source OCTA system for identifying choroidal neovascularization in AMD. Sci Rep. 2016;6: 38132.
5. Miller A, Zhang Q, Roisman L, et al., Comparison between spectral domain and swept source optical coherence tomography angiographic imaging of choroidal neovascularization. Invest Ophthalmol Vis Sci. In press.
6. Zhang Q, Chen CL, Chu Z, et al., Automated quantitation of choroidal neovascularization: a comparison study between spectral domain and swept source OCT angiograms. Invest Ophthalmol Vis Sci. In press.