In age-related macular degeneration (AMD), central serous chorioretinopathy (CSC), polypoidal choroidal vasculopathy (PCV), high myopia and uveitic diseases, choroidal neovascularization (CNV) can be a vision-threatening complication.3-5 The most common type of neovascularization that develops in these conditions is type 1 CNV, which arises from the choriocapillaris, penetrates through Bruch’s membrane (BM) and resides between the retinal pigment epithelium (RPE) and BM.
While patients and clinicians become aware of type 1 CNV once intraretinal, subretinal or sub-RPE fluid accumulates within the macula, the presence of a low-lying fibrovascular retinal pigment epithelial detachment (PED) often goes unnoticed and can be a harbinger of visual distortion due to fluid accumulation. A highly underappreciated anatomic feature on optical coherence tomography (OCT) B-scans that indicates early stage type 1 CNV is a low-lying PED referred to as the “double-layer sign” or DLS.6
What Is ‘Double-layer Sign’?
The presence of a DLS, which suggests the possibility
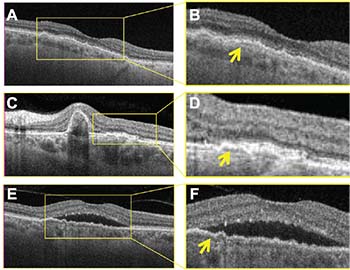 |
| FIGURE 1. Swept-source optical coherence tomography (OCT) B-Scans show the “double-layer sign” (DLS) in three different disease processes with type 1 macular neovascularization: non-exudative age-related macular degeneration (A, B); polypoidal choroidal vasculopathy (C, D); and central serous choiroretinopathy (E, F). Magnified images (B, D, F) show DLS where the neovascularization resides between Bruch’s membrane and the retinal pigment epithelium (arrows). |
How OCT-A Can Help
While a DLS suggests the presence of CNV, OCT angiography (OCT-A) can determine its actual presence. OCT-A detects blood flow by acquiring multiple B-scans at the same position and then applying a decorrelation algorithm to the datasets to detect flow. This method can differentiate moving particles from within blood vessels from the surrounding static tissue.
Algorithms can then generate en face structure and flow images. These en face flow images can be color-coded to
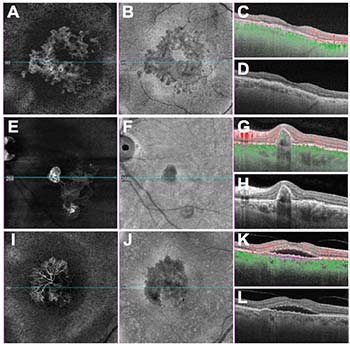 |
| FIGURE 2. Swept-source optical coherence angiographic images show the neovascular lesions that correspond to images in Figure 1: non-exudative age-related macular degeneration (A,B,C,D); polypoidal choroidal vasculopathy (E, F, G, H); central serous choiroretinopathy (I, J, K, L); en face flow images using a slab with boundaries between the retinal pigment epithelium (RPE) and Bruch’s membrane (A, E, I) and corresponding en face structure images from the same slab (B, F, J); B-scans with and without superimposed color-coded flow with red representing flow above the RPE and green representing flow beneath the RPE (C, D, G, H, K, L); and B-scan images with purple dashed boundaries corresponding to the en face images (C, G, K). |
Clinical Cases
Figures 1 and 2 offer clinical examples of OCT B-scans showing a DLS that represents type 1 CNV. In both figures, the top row shows examples of non-exudative neovascular AMD with type 1 CNV. The OCT B-scan with a DLS (Figure 1A) and the magnified area within the box (Figure 1B).
In the same case, the en face flow image (Figure 2A) shows a vascularized lesion under the RPE and the en face structure image (Figure 2B) shows an area of decreased intensity, which arises due to a space with decreased reflectivity compared with the surrounding tissue. These en face images correspond to a custom RPEFit segmentation strategy in which the inner boundary layer of the slab is the RPE and the outer boundary layer is BM. A horizontal foveal B-scan depicts the boundary layers as purple dashed lines and flow represented as red above the RPE and green below the RPE (Figures 2C, D).
The second row in both figures corresponds to an eye with PCV. The B-scan (Figure 1C) shows a peaked PED with an adjacent DLS corresponding to a branched vascularized network (BVN).
Magnified OCT B-scan better visualizes the DLS and the corresponding BVN (Figure 1D) while OCT-A en face flow imaging (Figure 2E) highlights the boundaries between the RPE and Bruch’s membrane along with the adjacent polyps. As with the first case, the B-scans with and without flow and with the segmentation boundaries are shown (Figures 2G, H).
The last row of both figures corresponds to an eye with CSC that has type 1 CNV. As with the previous examples, the DLS is evident on the magnified frame from the B-scan (Figure 1F) and the typical appearance of type 1 CNV can be appreciated on the en face flow image (Figure 2I). Once again, structural en face imaging depicts an area of decreased signal intensity on the structural image (Figure 2J), which suggests that the flow signal is real and supports the diagnosis of CNV. While type 1 CNV always causes an elevation of the RPE, not all elevations of the RPE correspond to type 1 CNV.
We have the diagnostic tools to distinguish between
 |
In our experience, swept-source OCT-A (SS-OCTA) does a better job of unambiguously identifying subtle non-exudative CNV than spectral-domain OCT-A. SS-OCTA may be even better than indocyanine green angiography. However, until SS-OCTA is widely available, routine structural OCT B-scans will provide the first clue as to whether type 1 CNV lurks beneath the RPE in eyes without exudation. RS
REFERENCES
1. Rosenfeld PJ. Optical coherence tomography and the development of antiangiogenic therapies in neovascular age-related macular degeneration. Invest Ophthalmol Vis Sci. 2016; 57:14-26.
2. Phadikar P, Saxena S, Rula S, Lal TY, Meyer CH, Eliott D. The potential of spectral domain optical coherence tomography imaging based retinal biomarkers. Int J Retina Vitreous. 2017;3: 1. doi: 10.1186/s40942-016-0054-7.
3. Weber ML, Heier JS. Choroidal neovascularization secondary to myopia, infection and inflammation. Dev Ophthalmol. 2016; 55:167-175.
4. Zarbin MA, Casaroli-Marano RP, Rosenfeld PJ. Age-related macular degeneration: clinical findings, histopathology and imaging techniques. Dev Ophthalmol. 2014; 53: 1-32
5. Nicholson B, Noble J, Forooghian F, Meyerle C. Central serous chorioretinopathy: update on pathophysiology and treatment. Surv Ophthalmol. 2013;58:103-126.
6. Sato T, Kishi S, Watanabe G, Matsumoto H, Mukai R. Tomographic features of branching vascular networks in polypoidal choroidal vasculopathy. Retina. 2007; 27:589-594.
7. Roisman L, Zhang Q, Wang RK, et al. Optical coherence tomography angiography of asymptomatic neovascularization in intermediate age-related macular degeneration. Ophthalmology. 2016;123:1309-1319.