| ABOUT THE AUTHOR | |
 | Dr. Chung is an associate professor of ophthalmology at Flaum Eye Institute at the University of Rochester (N.Y.) DISCLOSURES: Dr. Chung disclosed she receives research support from Canon Inc. and is a consultant to Glaxo Smith Kline. |
The advent of adaptive optics imaging has enabled non-invasive, in vivo visualization of single cells in the living human retina. Adaptive optics (AO) technology, originally developed at the University of Rochester in 1997, utilizes a wavefront sensor to measure the optical aberrations of the eye and correct them using a deformable mirror, attaining the high resolution necessary to resolve single cells.1
The original flood-illuminated AO retinal imaging system for the first time enabled an en-face view of the cone photoreceptor mosaic in the living retina. Individual red, blue and green cones could be classified using selective photoreceptor bleaching.2 The flood-illuminated system, however, had limited axial resolution and delayed image generation.
The combination of AO with scanning laser ophthalmoscopy (AOSLO) allows for real-time, through-focus imaging.3 The latest advances in deformable mirror technology and system design have achieved transverse resolution on the order of 2 µm,4,5 enabling visualization of not only cones at the fovea, where they are smallest, but also rod photoreceptors, which are smaller than cones.6 Six centers have applied versions of this design for research in AOSLO retinal imaging (Table).
With the implementation of wide-field eye tracking, image stabilization and digital processing techniques, AOSLO video images can be efficiently registered, montaged and correlated with conventional clinical images.7-9 The duration of an AOSLO imaging session can vary significantly depending on the size of the area to be imaged and the level of pathology present. To obtain targeted AOSLO sampling windows near the fovea in a healthy eye can take five minutes, whereas an intensive montage of the entire central 20* of the macula may require a full day of imaging, generating a great volume of cellular data.
Structures Revealed
Our prior knowledge of the cellular anatomy of the retina comes from histopathology. A landmark study in 199010 measured cones and rods from eight whole mounted human retinas, and established that the normal human retina contains 4.6 million cones, with cone density peaking at the fovea and falling steeply with increasing eccentricity. The average human retina contains 92 million rods, with a rod-free zone at the fovea and highest rod density at approximately 12* eccentricity.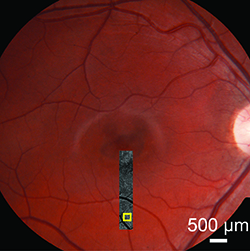 |
| Figure 1. Adaptive optics scanning laser ophthalmoscopy montage of the inferior meridian overlaid on the fundus photograph of the right eye of a teenage boy with macular atrophy due to Stargardt’s disease. The peripheral macula appears clinically unaffected. The yellow box indicates an area shown at higher magnification in Figure 2. |
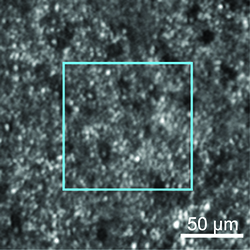 |
| Figure 2. AOSLO image of the cones and rods in the inferior macula, of the area indicated in Figure 1. The photoreceptor mosaic is continuous, but both cones and rods are enlarged, and “dark cones” are present. The blue box indicates an area shown at higher magnification in Figure 3 (below). |
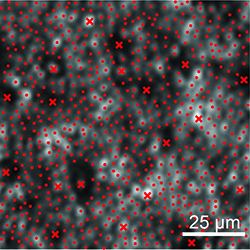 |
| Figure 3. Cone and rod labeling in the AOSLO image of the area indicated in Figure 2. x = cones, • = rods. |
A dual-imaging technique to detect RPE autofluorescence has achieved single-cell resolution of the retinal pigment epithelial (RPE) cells.13,14 This technique can also help identify labeled ganglion cells in animal models15 and perform high-resolution fluorescein angiography of the retinal capillaries.16 A “motion contrast” AOSLO processing method can image retinal capillaries at high resolution without the use of dyes because this method captures cell movement within vessels to identify microscopic vascular structures.17-19
Quantitative Analysis
Computational methods for AOSLO cellular measurements can label individual cones and rods semi-automatically and calculate density and spacing.20 Photoreceptor spacing metrics are more robust than density in retinal disease, when some photoreceptors can be damaged or absent.21For RPE cells, automated segmentation algorithms and Voronoi analysis for mosaic regularity allow morphometric analysis.22 AOSLO normative data for cone spacing has been obtained, and correlates well with published histology data.23
Microscopic Disease Detection
Using AOSLO, a decline in individual cones, rods and RPE cells can now be measured quantitatively in retinal diseases.24-27 In a Phase II clinical trial setting with a small number of study participants, AOSLO has demonstrated a treatment effect that other clinical endpoints could not detect.28In this study, three patients with retinitis pigmentosa received a sustained-release ciliary neurotrophic factor (CNTF) implant in one eye, and the fellow eye served as a control. After 24 months, AOSLO showed that the decline in cone density was 9 percent greater in the untreated eyes.
AOSLO can detect photoreceptor loss in areas that appear normal by conventional imaging modalities.29 Figure 1 shows a patient with Stargardt’s disease whose clinical phenotype is characterized by macular atrophy. However, AOSLO shows abnormalities in the peripheral photoreceptor mosaic, in areas where the fundus appears to be unaffected (Figures 2 and 3).
Both cones and rods appear enlarged and sparse, and the peripheral cone reflectance diminished, giving them a “dark cone” appearance. These dark cones have been described in retinal degenerations30,31 and likely represent foreshortened cone outer segments.
A recent study using AOSLO in Type 2 macular telangiectasia reported that areas of dark cones might recover over time.32 Dark cones may indicate potential target areas for localized treatments such as gene therapy.
Future Directions
AOSLO technology provides us with an unprecedented view of the retina at a cellular level. Individual cones, rods and RPE cells can now be measured quantitatively, and retinal diseases can be detected at a microscopic scale. Longitudinal AOSLO measurements can identify disease progression before conventional clinical tests. RSReferences
1. Liang J, Williams DR, Miller DT. (1997) Supernormal vision and high-resolution retinal imaging through adaptive optics. J Opt Soc Am A Opt Image Sci Vis. 1997;14: 2884-2892.2. Roorda A, Metha AB, Lennie P, Williams DR. Packing arrangement of the three cone classes in primate retina. Vision Res. 2001;41:1291-1306.
3. Roorda A, Romero-Borja F, Donnelly W 3rd, et al. Adaptive optics scanning laser ophthalmoscopy. Opt Express. 2002;10:405-412.
4. Gomez-Vieyra A, Dubra A, Malacara-Hernandez D, Williams DR. First-order design of off-axis reflective ophthalmic adaptive optics systems using afocal telescopes. Opt Express. 2009;17:18906–18919.
5. Dubra A, Sulai Y. The reflective afocal broadband adaptive optics scanning ophthalmoscope. Biomed Opt. Express. 2011;2:1757-1768.
6. Dubra A, Sulai Y, Norris J, et al. Non-invasive in vivo imaging of the human rod photoreceptor mosaic using a confocal adaptive optics scanning ophthalmoscope. Biomed Opt Express. 2011;2:1864-1876.
7. Yang Q, Zhang J, Nozato K, et al. Closed-loop optical stabilization and digital image registration in adaptive optics scanning light ophthalmoscopy. Biomed Opt Express. 2014;5:3174-3191.
8. Yang Q, Yin L, Nozato K, et al. Calibration-free sinusoidal rectification and uniform retinal irradiance in scanning light ophthalmoscopy. Opt Lett. 2015;40:85-88.
9. Zhang J, Yang Q, Saito K, Nozato K, Williams DR, Rossi EA. An adaptive optics imaging system designed for clinical use. Biomed Opt Express. 2015;6:2120-2137.
10. Curcio CA, Sloan KR, Kalina RE, et al. Human photoreceptor topography. J Comp Neurology. 1990;292:497-523.
11. Roorda A, Williams DR. The arrangement of the three cone classes in the living human eye. Nature. 1999;397:520-522.
12. Scoles D, Sulai YN, Langlo CS, et al. In vivo imaging of human cone photoreceptor inner segments. Invest Ophth Vis Sci. 2014;55:4244-4251.
13. Gray DC, Merigan W, Wolfing JI, et al. In vivo fluorescence imaging of primate retinal ganglion cells and retinal pigment epithelial cells. Opt Express. 2006;14: 7144-7158.
14. Morgan JI, Dubra A, Wolfe R, Merigan WH, Williams DR. In vivo autofluorescence imaging of the human and macaque retinal pigment epithelial cell mosaic. Invest Ophthalmol Vis Sci. 2009;50:1350-1359.
15. Gray DC, Wolfe R, Gee BP, et al. In vivo imaging of the fine structure of rhodamine labeled macaque retinal ganglion cells. Invest Ophthalmol Vis Sci. 2008;49:467–473.
16. Scoles D, Gray DC, Hunter JJ, et al. In-vivo imaging of retinal nerve fiber layer vasculature: imaging histology comparison. BMC Ophthalmol. 2009;1471-2415-9-9. Available at: http://www.biomedcentral.com/1471-2415/9/9. Accessed August 11, 2015.
17. Tam J, Martin JA, Roorda A. Noninvasive visualization and analysis of parafoveal capillaries in humans. Invest Ophthalmol Vis Sci. 2010;51:1691-1698.
18. Martin JA, Roorda A. Direct and noninvasive assessment of parafoveal capillary leukocyte velocity. Ophthalmology. 2005;112:2219-2224.
19. Rossi EA, Chung M, Dubra A, et al. Imaging retinal mosaics in the living eye. Eye. 2011;25:301-308.
20. Chui TY, Song H, Burns SA. Adaptive-optics imaging of human cone photoreceptor distribution. J Opt Soc Am. 2008;25:3021-3029.
21. Rossi EA, Roorda A. The relationship between visual resolution and cone spacing in the human fovea. Nat Neurosci. 2010;13:156-157.
22. Rangel-Fonseca P, Gómez-Vieyra A, et al. Automated segmentation of retinal pigment epithelium cells in fluorescence adaptive optics images. J Opt Soc Am A Opt Image Sci Vis. 2013;30:2595-2604.
23. Song H, Chui TY, Zhong Z, et al. Variation of cone photoreceptor packing density with retinal eccentricity and age. Invest Ophth Vis Sci. 2011;52:7376-7384.
24. Wolfing JI, Chung M, Carroll J, et al. High-resolution retinal imaging of cone-rod dystrophy. Ophthalmology. 2006;113:1014-1019.
25. Duncan JL, Zhang YH, Gandhi J, et al. High-resolution imaging with adaptive optics in patients with inherited retinal degeneration. Invest Ophth Vis Sci. 2007;48:3283-3291.
26. Sallo FB, Leung I, Chung M, et al; MacTel Study Group. Retinal crystals in type 2 idiopathic macular telangiectasia. Ophthalmology. 2011;118:2461-2467.
27. Rossi EA, Rangel-Fonseca P, Parkins K, et al. In vivo imaging of retinal pigment epithelium cells in age related macular degeneration. Biomed Opt Express. 2013;4:2527-2539.
28. Talcott KE, Ratmam K, Sundquist SM, et al. Longitudinal study of cone photoreceptors during retinal degeneration and in response to ciliary neurotrophic factor treatment. Invest Ophthalmol Vis Sci. 2011;52:2219-2226.
29. Carroll J, Neitz M, Hofer H, Neitz J, Williams DR. Functional photoreceptor loss revealed with adaptive optics: an alternate cause of color blindness. Proc Natl Acad Sci USA. 2004;101: 8461-8466.
30. Kim JE, Chung M. Adaptive optics for retinal imaging: current status. Retina. 2013;33:1483-1486.
31. Song H, Latchney L, Williams D, et al. Fluorescence adaptive optics scanning laser ophthalmoscope for detection of reduced cones and hypoautofluorescent spots in fundus albipunctatus. JAMA Ophthalmol 2014;132:1099-1104.
32. Wang Q, Tuten WS, Lujan B, et al. Adaptive optics microperimetry and OCT images in macular telangiectasia type 2 retinal lesions show preserved function and recovery of cone visibility. Invest Ophth Vis Sci. 2015;56:778-786.