 |
 |
Intravitreal injections have become a therapeutic mainstay in the treatment of many retinal conditions, and the latest data show that the number of intravitreal injections in the United States was projected to reach more than 6 million in 2016.1 Each injection acutely and temporarily increases intraocular pressure, but the long-term effects of these IOP changes are not known.2
Multiple studies have concluded that an increased number of injections given correlates with sustained, long-term, elevations in IOP.3-7 Here, we review our own research, previously published in the journal Retina, of how IOP elevations from IVT injections affect ocular perfusion.8
 |
What the data show
Studies have shown that IOP spikes to an average of 44 mmHg immediately after injection, decreases to 35 mmHg two to three minutes later, and then drifts back to a baseline of 15 mmHg within 30 minutes.2 Some patients in our clinic had acute IOP elevations as high as 61 mmHg with 0.05-mL injections, and up to 71 mmHg with double-dose 0.1-mL injections.
The largest study of 23,776 patients that received 12 to 25 anti-VEGF injections showed that 2.6 percent of injected eyes had a significant IOP increase (>6 mmHg to <21 mmHg) compared with 1.5 percent of untreated fellow eyes.4 While this study controlled for a diagnosis of glaucoma, it did not account for patients that received treatment in the form of a new glaucoma medication or glaucoma surgery between baseline and year one.
Furthermore, this study excluded patients with an IOP of 22 mmHg or more at baseline, a subset of patients that may be more prone to glaucoma. Thus, the study may have underestimated the effects of injections on IOP and glaucoma.
MARINA, ANCHOR subanalysis
These data are not new. A subanalysis of the MARINA and ANCHOR trials found that intravitreal injections increased the risk of clinically significant IOP elevation: 23.6 percent of those getting ranibizumab (Lucentis, Roche/Genentech) had clinically significant IOP increases, but only 13.6 percent of sham did.9
Additionally, not all patients respond the same way. Patients with preexisting glaucoma, or with a predisposition to glaucoma, are likely at higher risk. Elizabeth Atchison, MD, and colleagues reported that three times more patients who had a significant IOP rise after intravitreal injections had a preexisting diagnosis of glaucoma.4
Two mechanisms by which IVT injections may sustainably increase IOP are:
• damage to the trabecular meshwork10 incites inflammation that alters the TM;11 and
• blockage of TM outflow due to injected anti-VEGF agents,12 proteins or contaminant particles in the solution, such as silicone oil.13
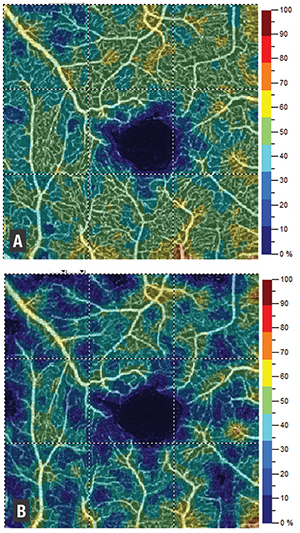 |
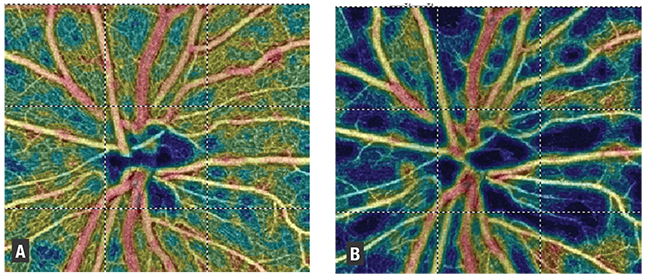
| Figure 1. Optical coherence tomography angiography shows noted differences in macular perfusion before (A) and after (B) intravitreal injection. |
Evidence of long-term IOP effects
Despite multiple studies that suggest IVT injections lead to sustained IOP elevations in a subset of patients, a meta-analysis reported mixed data on long-term IOP elevation.7 Studies have shown 4 to 15 percent of patients have sustained IOP elevation at nine to 24 months, while 6 percent had no long-term change in IOP at one to 36 months in a review.14
While the early data on long-term IOP elevations are mixed, a growing body of evidence suggests that pressure spikes with intraocular injections can have long-term glaucomatous effects, even in eyes in which injections do not lead to sustained IOP elevations. Progressive retinal nerve fiber layer thinning occurs in IVT-treated eyes,15 and a higher number of IVT injections is associated with the need for glaucoma surgery.3
How we designed our study
Based on the growing body of evidence that intravitreal injections can affect ocular perfusion and increase the risk of glaucomatous changes, we designed a study to assess the acute changes in macular and peripapillary perfusion density and macular thickness following IVT injections using optical coherence tomography imaging with and without angiography.8 Our goal was to describe the retinal perfusion changes and thickness alterations associated with acute IOP elevations. Data about the pathophysiology of acute IOP elevations can be further extrapolated to other causes of acute IOP elevation, such as intraocular surgery and in acute angle closure.
 |
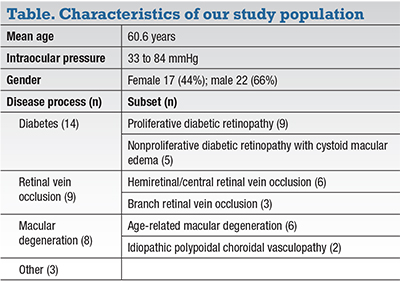
We imaged 40 eyes of 39 adults without media opacities or other ocular changes that would preclud OCT-A (table, page 26). Eyes received intravitreal injections of: 0.05 mL bevacizumab (1.25 mg, Avastin, Roche/Genentech, n=32); 0.05 mL aflibercept (2 mg, Eylea, Regeneron, n=3); and 0.1 mL bevacizumab (2.50 mg, n=5) in eyes that also received radiation retinopathy per our ocular oncologist’s protocol. The injections were given for a diverse set of diseases including diabetic retinopathy, macular degeneration, choroidal neovascular membrane and retinal vein occlusion. Intraocular pressures were checked with a Tonopen (Reichert) before and 15 seconds after injection.
OCT-A imaging of the macular (3 x 3 mm) and peripapillary (4.5 x 4.5 mm) areas was obtained before and immediately after injections (within two to three minutes) using the RTVue XR 100 Avanti machine (Optovue). The limiting factor was how quickly each patient could be transferred from the injection procedure room to the imaging suite. AngioAnalytics software performed automatic segmentation of vessel layers into superficial and deep, as well as into the following subsections:
-
macular OCT-A, subdivided into nine regions of interest—macula, fovea, parafovea, superior hemifield, inferior hemifield, temporal, superior, nasal and inferior; and
-
peripapillary OCT-A, subdivided into eight regions of interest—optic nerve head, peripapillary, nasal, temporal, inferonasal, inferotemporal, superotemporal and superonasal.
Paired t-test analysis of each patient’s pre- and postinjection OCT-A perfusion density and macular OCT thickness, and regression analysis regarding the confounding effects of the patient’s age, baseline IOP and IOP change as independent variables, were performed in STATA (v14.2, StataCorp). P values less than 0.05 were considered statistically significant.
 |
How injections affect macular, optic nerve perfusion density
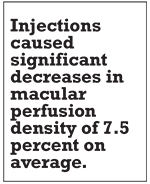
Injections caused significant acute decreases in macular perfusion density of 7.5 percent on average, but did not significantly affect perfusion of the fovea. The deep macula was also affected, with an average decrease of 2.4 percent, one-third that of the superficial perfusion.
Macular thickness was significantly decreased in the temporal and significantly increased in the nasal aspects, possibly a redistribution phenomenon. Overall OCT thickness was unchanged.
Injections also significantly decreased optic nerve perfusion density, with an average change of 3.3 percent in the optic nerve head. In the radial peripapillary capillary (RPC) layer, essentially the superficial perfusion in the peripapillary area, perfusion density decreased 2.9 percent on average. The temporal aspect of the disc was most affected.
 |
Age was significantly related to overall superficial macular perfusion, suggesting that older patients may be at higher risk for perfusion changes with injections. IOP change was related to decreased overall superficial macular perfusion, suggesting that the extent of the pressure spike impacts the extent of decreased perfusion in the superficial macula.
Overall, our study showed that intravitreal injections produce acute IOP changes that are associated with reduced macular and peripapillary perfusion density. Therefore, it is possible that patients receiving regular intravitreal injections may be sustaining perfusion-related injury to ocular structures that may produce glaucomatous damage to the macula and optic nerve.
 |
| Figure 2. Optical coherence tomography angiography shows perfusion density significantly decreased in optic nerve scans when pre- and postinjection images (A, B) were compared. |
 |
OCT-A and macular perfusion
OCT-A has been used to identify vascular changes in a variety of ophthalmic diseases,16,17 including glaucoma. OCT-A measurements of peripapillary angiographic perfusion density can help diagnose and quantify glaucoma prior to RNFL thickness changes or visual field losses.18,19
Additionally, OCT-A perfused capillary density may have diagnostic accuracy comparable to RNFL thickness measurements for differentiating healthy and glaucomatous eyes.18 These results suggest that OCT-A measurements identify early damage to tissues that may contribute to the pathophysiology of glaucoma.
In our study, we found that macular perfusion was decreased after intravitreal injections (Figure 1, page 23), with significantly more of an effect on superficial macular vessels (7.5 percent decrease in perfusion on average) than deep vessels (decrease of 2.4 percent).
This matches the findings of Hana Takusagawa, MD, and colleagues at Casey Eye Institute in Oregon—that glaucoma patients have significantly decreased macular perfusion on OCT-A, affecting the superficial plexus more than the deep.20 Thus, it is possible that we are seeing the acute ischemic effects of increased IOP. This lends credence to the idea that intravitreal injections may stress the same structures that are damaged in glaucomatous eyes.
Our study found that OCT-A perfusion density was significantly decreased in both optic nerve scans (Figure 2), with an average change of approximately 3 percent. The temporal aspect of the nerve was most significantly affected. These results agree with several other studies,21 including a study by Gabor Hollo in Hungary that reported peripapillary superficial capillary perfusion density increased significantly with an IOP reduction of 50 percent or more (over approximately one month).22
Researchers at UCLA found that retinal capillary perfusion density measured one month after injection of anti-VEGF was unchanged,23 suggesting that our mea- surements are of short-term effects more likely to be related to IOP rather than medication. Our study also corroborates other reports that OCT thickness does not change significantly with acute IOP eleva- tions due to intravitreal injections.23
Understanding effects in perfusion
We are likely underestimating the transient impact on perfusion. We measured IOP 15 seconds after injection, whereas the OCT-A was done at >2 minutes, when IOP was in the process of equilibration. If the OCT-A images had been taken closer to the time of injection, they might have shown even greater changes in perfusion density and possibly OCT thickness.
It is important to note that while IOP rises to such high pressures immediately upon injection, the pressures are generally not sustained. A major risk stems from the repetitive nature of such injections and the potential for cumulative trauma to the retina and optic nerve.3
 |
As we previously mentioned, there is so far mixed data about the IOP effects of intravitreal injections. While in the short term most eyes may tolerate injections, the risk of damage likely increases over the longer term, on a cumulative basis. Diabetic Retinopathy Clinical Research Network studies support this, showing a 5.7 percent rate of sustained clinically significant IOP increase at one year, almost doubling to 9.5 percent after three years of injections.24
The temporal RNFL may be at high- est risk for glaucomatous damage from repeated IOP spikes from IVT injections, because it has shown the largest postinjec- tion perfusion change. It should be pref- erentially monitored for evidence of early RNFL thinning following IVT injections. Ganglion cells that rely on superficial mac- ular plexus for perfusion may be especially vulnerable.
Is pretreatment an option?
Larger, long-term studies are needed to identify glaucomatous changes in patients who undergo repeated injections. A meta-analysis found the following were associated with lower IOP elevations after IVT injections:14
-
pretreatment with topical glaucoma medications;
-
anterior chamber paracentesis;
-
vitreous reflux;
-
longer intervals between injections; and
-
longer axial lengths.
Perhaps we should consider pretreatment with IOP-lowering medications of all or a subset of patients most susceptible to injury. There is an ongoing study at the New York Eye and Ear Infirmary to test the effects of premedication with apraclonidine 0.5%.
In our clinic, we have begun to weigh the risks of injections in patients with mild macular edema if they have preexisting glaucoma or cupping. We now tend to wait to allow these patients’ blood-pressure and blood-glucose levels to stabilize, when possible, to minimize their risk of glaucoma.
The impact of greater injection volumes such as those given with 0.1 mL triamcinolone or 0.1 mL bevacizumab for radiation retinopathy needs further investigation. Few patients in our study received 0.1 mL, and although mean IOP in these patients was higher after injection, it is difficult to draw any conclusions given the limited number of patients receiving this dose.
Our study population was very diverse; diagnosis, age, and other patient and dis- ease characteristics differed significantly. The patient population may have included individuals with undiagnosed glaucoma or other changes that could skew the data. The effects of intravitreal injections in each disease state or patient may vary and may affect the outcomes we measured. Patients were used as their own controls, and the changes that occurred within each individual patient correlated well with our overall results. Future studies of larger patient populations will be helpful to confirm that these changes are real and reproducible.
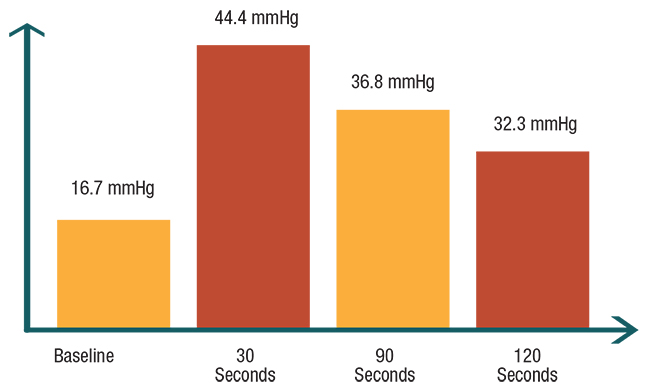 |
| Figure 3. In the authors’ pilot study of 10 patients, the average intraocular pressure measurements in study eyes rosed significantly from baseline at three different time intervals after intravitreal injections. |
 |
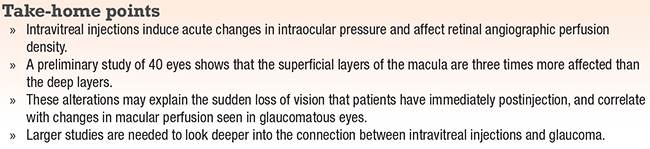
The bottom line
Intravitreal injections induce acute changes in IOP and affect retinal angiographic capillary perfusion density. Our preliminary study of 40 eyes shows that the superficial layers of the macula are more affected than deep layers, by a factor of three. These alterations may explain the sudden loss of vision that patients have immediately postinjection, and correlate with changes in macular perfusion seen in glaucomatous eyes.20 The temporal aspect of the optic nerve has the most significant decreases in perfusion density, so it may be prudent to focus on this area with serial perfusion scans, RNFL measurements and visual fields to assess the long-term glaucomatous effects of intravitreal injections.
We need further research with larger sample sizes and longitudinal data about glaucoma progression to look deeper into the connection between intravitreal injections and glaucoma. These studies will also provide a window into the pathophysiology of perfusion changes that occur during other instances of acute IOP elevation, such as acute angle closure and malignant glaucoma and during intraocular surgery, and help point to more effective therapeutic interventions.
REFERENCES
1. Williams GA. IVT Injections: Health policy implications. Rev Ophthalmol. 2014;21:62-64.
2. Lee JW, Park H, Choi JH, et al. Short-term changes of intraocular pressure and ocular perfusion pressure after intravitreal injection of bevacizumab or ranibizumab. BMC Ophthalmol. 2016;16:69.
3. Eadie BD, Etminan M, Carleton BC, Maberley DA, Mikelberg FS. Association of repeated intravitreous bevacizumab injections with risk for glaucoma surgery. JAMA Ophthalmol. 2017;135:363-368.
4. Atchison EA, Wood KM, Mattox CG, Barry CN, Lum F, MacCumber MW. The real-world effect of intravitreous anti-vascular endothelial growth factor drugs on intraocular pressure: An analysis using the IRIS registry. Ophthalmology. 2018;125:676-682.
5. Hoang QV, Mendonca LS, Della Torre KE, Jung JJ, Tsuang AJ, Freund KB. Effect on intraocular pressure in patients receiving unilateral intravitreal anti-vascular endothelial growth factor injections. Ophthalmology. 2012;119:321-326.
6. Moraru A, Pinzaru G, Motoc A, Costin D, Branisteanu D. Incidence of ocular hypertension after intravitreal injection of anti-VEGF agents in the treatment of neovascular AMD. Rom J Ophthalmol. 2017;61:207-211.
7. Vo Kim S, Fajnkuchen F, Sarda V, Qu-Knafo L, Bodaghi B, Giocanti- Auregan A. Sustained intraocular pressure elevation in eyes treated with intravitreal injections of anti-vascular endothelial growth factor for diabetic macular edema in a real-life setting. Graefes Arch Clin Exp Ophthalmol. 2017;255:2165-2171.
8. Barash A, Chul TYP, Garcia P, Rosen RB. Acute macular and peripapillary angiographic changes with intravitreal injections. Retina. 2019 Feb 11. [Epub ahead of print]
9. Bakri SJ, Moshfeghi DM, Francom S, et al. Intraocular pressure in eyes receiving monthly ranibizumab in two pivotal age-related macular degeneration clinical trials. Ophthalmology. 2014;121:1102-1108.
10. Kim JE, Mantravadi AV, Hur EY, Covert DJ. Short-term intraocular pressure changes immediately after intravitreal injections of anti-vascular endothelial growth factor agents. Am J Ophthalmol. 2008;146:930-934 e931.
11. Menke MN, Salam A, Framme C, Wolf S. Long-term intraocular pressure changes in patients with neovascular age-related macular degeneration treated with ranibizumab. Ophthalmologica. 2013;229:168- 172.
12. Kahook MY, Ammar DA. In vitro effects of antivascular endothelial growth factors on cultured human trabecular meshwork cells. J Glaucoma. 2010;19:437-441.
13. Kahook MY, Liu L, Ruzycki P, et al. High-molecular-weight aggregates in repackaged bevacizumab. Retina. 2010;30:887-892.
14. Hoguet A, Chen PP, Junk AK, et al. The effect of anti-vascular endothelial growth factor agents on intraocular pressure and glaucoma: A report by the American Academy of Ophthalmology. Ophthalmology. 2018 Nov 22. [Epub ahead of print]
15. Martinez-de-la-Casa JM, Ruiz-Calvo A, Saenz-Frances F, et al. Retinal nerve fiber layer thickness changes in patients with age-related macular degeneration treated with intravitreal ranibizumab. Invest Ophthalmol Vis Sci. 2012;53:6214-6218.
16. de Carlo TE, Romano A, Waheed NK, Duker JS. A review of optical coherence tomography angiography (OCTA). Int J Retina Vitreous. 2015;1:5.
17. Chen CL, Wang RK. Optical coherence tomography based angiography [Invited]. Biomed Opt Express. 2017;8:1056-1082.
18. Yarmohammadi A, Zangwill LM, Diniz-Filho A, et al. Optical coherence tomography angiography vessel density in healthy, glaucoma suspect, and glaucoma eyes. Invest Ophthalmol Vis Sci. 2016;57:OCT451-459.
19. Shin JW, Lee J, Kwon J, Choi J, Kook MS. Regional vascular density- visual field sensitivity relationship in glaucoma according to disease severity. Br J Ophthalmol. 2017;101:1666-1672.
20. Takusagawa HL, Liu L, Ma KN, et al. Projection-resolved optical coherence tomography angiography of macular retinal circulation in glaucoma. Ophthalmology. 2017;124:1589-1599.
21. Schmidl D, Boltz A, Kaya S, et al. Comparison of choroidal and optic nerve head blood flow regulation during changes in ocular perfusion pressure. Invest Ophthalmol Vis Sci. 2012;53:4337-4346.
22. Hollo G. Influence of large intraocular pressure reduction on peripapillary OCT vessel density in ocular hypertensive and glaucoma eyes. J Glaucoma. 2017;26:e7-e10.
23. Ghasemi Falavarjani K, Iafe NA, Hubschman JP, Tsui I, Sadda SR, Sarraf D. Optical coherence tomography angiography analysis of the foveal avascular zone and macular vessel density after anti-VEGF therapy in eyes with diabetic macular edema and retinal vein occlusion. Invest Ophthalmol Vis Sci. 2017;58:30-34.
24. Bressler SB, Almukhtar T, Bhorade A, et al. Repeated intravitreous ranibizumab injections for diabetic macular edema and the risk of sustained elevation of intraocular pressure or the need for ocular hypotensive treatment. JAMA Ophthalmol. 2015;133:589-597.