 |
Many studies have attempted to identify predictive biomarkers for the progression of intermediate AMD to advanced AMD. Among the risk factors natural history studies have demonstrated for progression to advanced AMD are advanced AMD in the fellow eye, large, soft drusen and AMD-related pigmentary abnormalities (Figure 1).1
Because of this, biomarkers on imaging studies, most notably on optical coherence tomography, have become an attractive option due to the ease of acquisition and ubiquity of OCT. In particular, various authors have described drusen characteristics as risk factors for the progression of AMD.2,3
Available OCT algorithms can aid in following drusen load, described by the height, area and volume of drusen over time, and can identify biomarkers for progression to advanced AMD.2 This article will review the evidence supporting the use of OCT and fundus autofluorescence to identify biomarkers of advancing AMD.
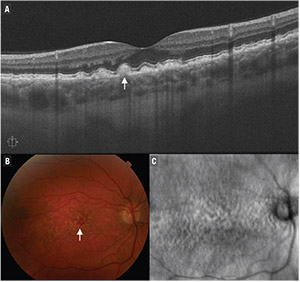 |
| Figure 1. B-scan optical coherence tomography demonstrates large soft drusen (A), depicted as retinal pigment epithelium elevations greater than 125 μm (arrow). Also shown are the corresponding color fundus photograph (B) and en-face OCT image (C). |
The Age Related Eye Disease Study (AREDS) group classifies AMD into three categories, based on the type and severity of fundus lesions, including drusen dimensions and pigmentary changes that have been demonstrated to be of value in predicting the risk of AMD progression:1
• early AMD, defined as the presence of medium drusen (63 to 125 μm) with no pigmentary abnormalities;
• intermediate AMD, defined as the presence of large drusen (>125 μm) or medium drusen in the presence of pigmentary abnormalities; and
• advanced AMD, characterized by neovascularization and/or geographic atrophy.4
Drusen Characteristics
Both drusen area and volume have been associated with the development of GA and neovascular AMD, based on findings from researchers at the University of British Columbia, who studied 83 patients with intermediate AMD.2 This may result from focal loss of the overlying photoreceptors and the outer retina due to focal disruption and compression. Others have suggested drusen height may be a risk factor for intermediate AMD progression.5,6
A small study of 30 patients reported that a subgroup that progressed to neovascular AMD had a mean drusen height of 122 μm, whereas the group that did not progress had a mean drusen height of 71 μm.6 A larger study at Stanford University described a statistical model using spectral-domain OCT scans of patients with early and intermediate AMD and reported that drusen area, volume and height predicted progression to advanced AMD.5
 |
Analyzing 143 eyes with nonexudative AMD, researchers at Bascom Palmer Eye Institute reported that in 12 percent of cases, drusen volume actually decreased with a magnitude dependent on the baseline drusen volume.7 The AREDS group reported that drusen regression is a risk factor, as 82 percent of the eyes that developed GA had preceding drusen regression and hypopigmentary changes.8 Austrian researchers further supported this finding; in 50 eyes with early to intermediate AMD, drusen regression occurred in 44 percent of the cohort, which preceded the progression to advanced AMD— both GA and nAMD—in every case in their study.3
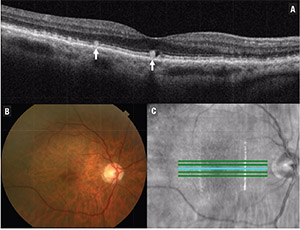 |
| Figure 2. Optical coherence tomography of the macula shows the presence of reticular pseudodrusen (A), which are subretinal collections of granular and hyper-reflective material (arrow). Also shown are the corresponding color fundus photograph (B) and en-face OCT image (C). |
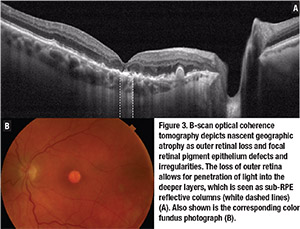
Other signs described as precursor lesions for the development of advanced AMD include hyper-reflective foci, reticular pseudodrusen, nascent GA, subretinal pigment epithelium reflective columns and OCT-reflective drusen substructures.9
• Hyper-reflective foci. Authors have described hyper-reflective foci as representing pigment migration, displacement and clumping of degenerated retinal pigment epithelium cells. An extension of the AREDS2 study using SD-OCT demonstrated that patients with hyper-reflective foci on OCT at baseline had a fivefold increased risk of progression to GA, but not wet AMD, at two years when compared with controls.9
• Reticular pseudodrusen. These subretinal collections of granular, hyper-reflective material are found most commonly in the superior macula or superotemporal arcades (Figure 2). Reticular pseudodrusen are found to be present in approximately 9 to 58 percent of patients with intermediate AMD, depending on the population studied.10,11 Researchers in Australia reported that the presence of reticular pseudodrusen is associated with an additional 2.64-fold increased risk of progression to nAMD or central GA, with the risk of progression higher for reticular pseudodrusen located outside the macula.10
 |
• Sub-RPE hyper-reflective columns. These narrow columns of hyper-reflectivity seen under the RPE suggest deficiencies in the RPE layer.15 Lissa Padnick-Silver, PhD, and colleagues described sub-RPE hyper-reflective columns in 27 percent of eyes that progressed to nAMD in their cohort, which preceded the onset of exudative changes or GA by at least three months.15
• OCT-reflective drusen substructures. Variation in the structure and properties of drusen as they appear on OCT has also been proposed to portend an increased risk of AMD progression. On OCT, drusen usually appear as a smooth, dome-shaped RPE elevation with homogeneous medium internal reflectivity. However, varying morphology, reflectivity and internal homogeneity may be observed.
A large multicenter study investigated such variations in 349 patients with intermediate AMD enrolled in the AREDS2 SD-OCT study.16 The authors described four phenotypic subtypes of variations or OCT-reflective drusen substructures (ODS):
• low-reflective cores;
• high-reflective cores;
• conical debris; and
• split drusen.
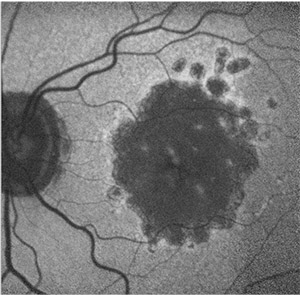 |
| Figure 4. Fundus autofluorescence image of geographic atrophy exhibits a banded pattern surrounding areas of atrophy, which carries an increased risk of age-related macular degeneration progression. |
• Other morphologic features. Other morphologic features found on OCT have been associated with AMD progression. Ellipsoid zone disruption has been associated with progression to advanced AMD and neovascularization, with an odds ratio of 17.9.13
Other features also independently associated with progression to advanced AMD, based on a multivariate stepwise model, include presence of drusenoid RPE detachment, presence of RPE thickening, focal irregularity (thickening or thinning) of the retina, irregularity or disruption of the external limiting membrane and choroidal vessel abnormalities noted on OCT.13 Similarly, researchers in South Korea have described subfoveal choroidal thickness as a possible marker for GA progression.17
Emergence of OCT-A
The recent advent of OCT angiography provides a rapid and noninvasive method by which clinicians and researchers can diagnose and monitor nonexudative neovascularization in eyes with dry AMD.18 A multicenter study and a French study were among the first to demonstrate the ability of OCT-A to detect nonexudative neovascularization in patients with phenotypic dry AMD.19,20 These authors reported that the lesions demonstrated ill-defined hyperfluorescence with no leakage on fluorescein angiography, hypercyanescence in a plaque configuration on indocyanine green angiography, and a shallow, irregular pigment epithelial detachment with moderate hyperreflectivity and a major axis in the horizontal plane.
A follow-up study using sweptsource OCT-A reported that 14.4 percent of patients with intermediate and late nonexudative AMD, who had exudative AMD in the fellow eye, had evidence of subclinical macular neovascularization (MNV).21 Patients with phenotypic intermediate dry AMD, but who had subclinical MNV, carried an increased risk of conversion to exudative AMD compared to patients who did not have nonexudative MNV (21.1 percent vs. 5.4 percent at one-year follow-up).
Swept-source OCT-A, with its longer wavelength and deeper tissue penetration, has also been used to image the choriocapillaris in patients with intermediate and advanced AMD. A multinational study demonstrated focal choriocapillaris flow impairment associated with areas of nascent GA and drusen-associated GA.22 Other authors have postulated that choriocapillaris flow is impaired under drusen, which may represent a promising clinical marker for disease progression.23
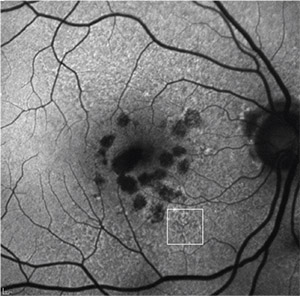 |
| Figure 5. Fundus autofluorescence of multifocal geographic atrophy presenting as multiple discrete foci of retinal pigment epithelium atrophy, which carries a risk of geographic atrophy progression. Reticular pseudodrusen is also visible (white square). |
Investigators have described the use of other imaging modalities, such as fundus autofluorescence (FAF), in intermediate AMD. Although varying patterns of FAF have been described, no particular pattern has been associated with conversion or progression of intermediate AMD.24 However, researchers in Portugal reported that FAF abnormalities were predictive of progression to advanced AMD, with a 93 percent sensitivity.24
Hyperfluorescence surrounding GA has also been noted on FAF, with certain junctional patterns associated with an increased risk of GA progression. The Fundus Autofluorescence in Age-related Macular Degeneration (FAM) study characterized abnormalities in the junctional zone of GA into four categories:25
• focal increased;
• banded;
• patchy; and
• diffuse.26
Progression rates in eyes with the banded and diffuse FAF pattern were significantly higher compared to eyes without FAF abnormalities or with focal FAF patterns (Figure 4). An additional diffuse trickling pattern exhibited an even greater progression of GA when compared to the other diffuse types.26 Furthermore, the presence of multifocal atrophic spots and extrafoveal lesions were biomarkers predictive of GA progression (Figure 5).27
Because AMD progression carries a significant negative visual prognosis, its detection has crucial clinical implications. Not only do predictive biomarkers seen on imaging provide insight into AMD progression; they may also prove valuable in managing and monitoring this disease.
References
1. Ferris FL, Davis MD, Clemons TE, et al. A simplified severity scale for age-related macular degeneration: AREDS Report No. 18. Arch Ophthalmol. 2005;123:1570-1574.
2. Nathoo NA, Or C, Young M, et al. Optical coherence tomography-based measurement of drusen load predicts
development of advanced age-related macular degeneration. Am J Ophthalmol. 2014;158:757-761.e1.
3. Schlanitz FG, Baumann B, Kundi M, et al. Drusen volume development over time and its relevance to the course of agerelated macular degeneration. Br J Ophthalmol. 2017;101:198203.
4. Ferris FL, Wilkinson CP, Bird A, et al. Clinical classification of age-related macular degeneration. Ophthalmology. 2013;120:844-851.
5. de Sisternes L, Simon N, Tibshirani R, Leng T, Rubin DL. Quantitative SD-OCT imaging biomarkers as Indicators of agerelated macular degeneration progression. Invest Opthalmol Vis Sci. 2014;55:7093.
6. Dieaconescu DA, Dieaconescu IM, Williams MA, Hogg RE, Chakravarthy U. Drusen height and width are highly predictive markers for progression to neovascular AMD. Invest Ophthalmol Vis Sci. 2012;53:2910.
7. Yehoshua Z, Wang F, Rosenfeld PJ, Penha FM, Feuer WJ, Gregori G. Natural history of drusen morphology in age-related macular degeneration using spectral domain optical coherence tomography. Ophthalmology. 2011;118:2434-2441.
8. Klein ML, Ferris FL, Armstrong J, et al. Retinal precursors and the development of geographic atrophy in age-related macular degeneration. Ophthalmology. 2008;115:1026-1031.
9. Christenbury JG, Folgar FA, O’Connell R V., et al. Progression of intermediate age-related macular degeneration with proliferation and inner retinal migration of hyperreflective foci. Ophthalmology. 2013;120:1038-1045.
10. Zweifel SA, Imamura Y, Spaide TC, Fujiwara T, Spaide RF.
Prevalence and significance of subretinal drusenoid deposits (reticular pseudodrusen) in age-related macular degeneration. Ophthalmology. 2010;117:1775-1781.
11. Ly A, Yapp M, Nivison-Smith L, Assaad N, Hennessy M, Kalloniatis M. Developing prognostic biomarkers in intermediate age-related macular degeneration: Their clinical use in predicting progression. Clin Exp Optom. 2018;101:172-181.
12. Wu Z, Luu CD, Ayton LN, et al. Optical coherence tomography–defined changes preceding the development of drusen-associated atrophy in age-related macular degeneration. Ophthalmology. 2014;121:2415-2422.
13. Ferrara D, Silver RE, Louzada RN, Novais EA, Collins GK, Seddon JM. Optical coherence tomography features preceding the onset of advanced age-related macular degeneration. Invest Opthalmology Vis Sci. 2017;58:3519-3529.
14. Sadda SR, Guymer R, Holz FG, et al. Consensus definition for atrophy associated with age-related macular degeneration on OCT: Classification of atrophy report 3. Ophthalmology. 2018;125:537-548.
15. Padnick-Silver L, Weinberg AB, Lafranco FP, Macsai MS. Pilot study for the detection of early exudative age-related macular degeneration with optical coherence tomography. Retina. 2012;32:1045-1056.
16. Veerappan M, El-Hage-Sleiman A-KM, Tai V, et al. Optical coherence tomography reflective drusen substructures predict progression to geographic atrophy in age-related macular degeneration. Ophthalmology. 2016;123:2554-2570.
17. Lee JY, Lee DH, Lee JY, Yoon YH. Correlation between subfoveal choroidal thickness and the severity or progression of nonexudative age-related macular degeneration. Invest Opthalmol Vis Sci. 2013;54:7808-7812.
20. Or C, Sabrosa AS, Sorour O, Arya M, Waheed N. Use of OCTA, FA, and ultra-widefield imaging in quantifying retinal ischemia: A review. Asia-Pacific J Ophthalmol. 2018;7:46-51.
19 Roisman L, Zhang Q, Wang RK, et al. Optical coherence tomography angiography of asymptomatic neovascularization in intermediate age-related macular degeneration. Ophthalmology. 2016;123:1309-1319.
20. Querques G, Srour M, Massamba N, et al. Functional characterization and multimodal imaging of treatment-naïve “quiescent” choroidal neovascularization. Invest Opthalmgy Vis Sci. 2013;54:6886.
21. de Oliveira Dias JR, Zhang Q, Garcia JMB, et al. Natural history of subclinical neovascularization in nonexudative age-related macular degeneration using swept-source oct angiography. Ophthalmology. 2017;125:255-266.
22. Novais EA, Adhi M, Moult EM, et al. Choroidal neovascularization analyzed on ultrahigh-speed swept-source optical coherence tomography angiography compared to spectral-domain optical coherence tomography angiography. Am J Ophthalmol. 2016;164:80-88.
23. Chatziralli I, Theodossiadis G, Panagiotidis D, Pousoulidi P, Theodossiadis P. Choriocapillaris vascular density changes in patients with drusen: Cross-sectional study based on optical coherence tomography angiography findings. Ophthalmol Ther. 2018;7:101-107.
24. Cachulo L, Silva R, Fonseca P, et al. Early markers of choroidal neovascularization in the fellow eye of patients with unilateral exudative age-related macular degeneration. Ophthalmologica. 2011;225:144-149.
25. Bindewald A, Schmitz-Valckenberg S, Jorzik JJ, et al. Classification of abnormal fundus autofluorescence patterns in the junctional zone of geographic atrophy in patients with age related macular degeneration. Br J Ophthalmol. 2005;89:874878.
26. Holz FG, Bindewald-Wittich A, Fleckenstein M, et al. Progression of geographic atrophy and impact of fundus autofluorescence patterns in age-related macular degeneration. Am J Ophthalmol. 2007;143:463-472.e2.
27. Schmitz-Valckenberg S, Sahel J-A, Danis R, et al. Natural history of geographic atrophy progression secondary to agerelated macular degeneration (Geographic Atrophy Progression Study). Ophthalmology. 2016;123:361-368.